This week did not finish above the resistance but, it did put a wick through the weekly trend line.
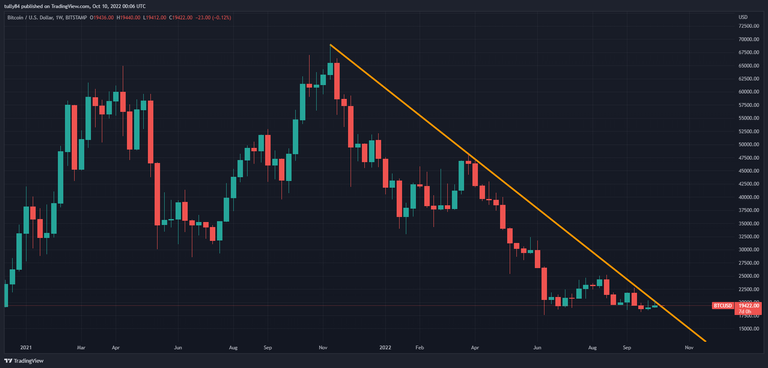
To gain some insight into what next week may bring we must zoom in and look at the 1d candles.
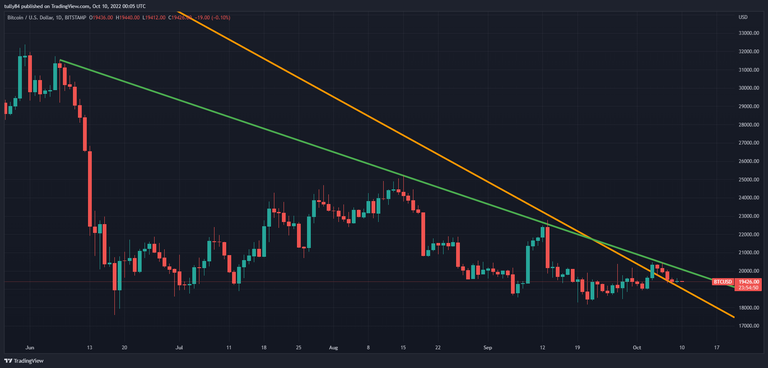
The orange trend line is the weekly trend line and is currently providing support. Price is also supported by the 21 Moving Average.
The green trend line is a daily trend line and is acting as resistance. As this is the first day of the new 1w candle, I expect some volatility. If the bulls can defend this support there is a high probability that this week gives us a volume break of the daily trend and the previous high.
If we get a break down today my sentiment will turn bearish and I will exit my long position.
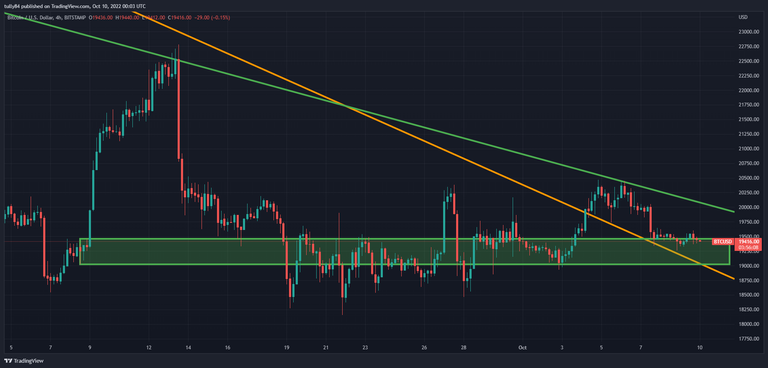
I bought the green box on the 4H chart. And I have another buy close to the bottom of the box.