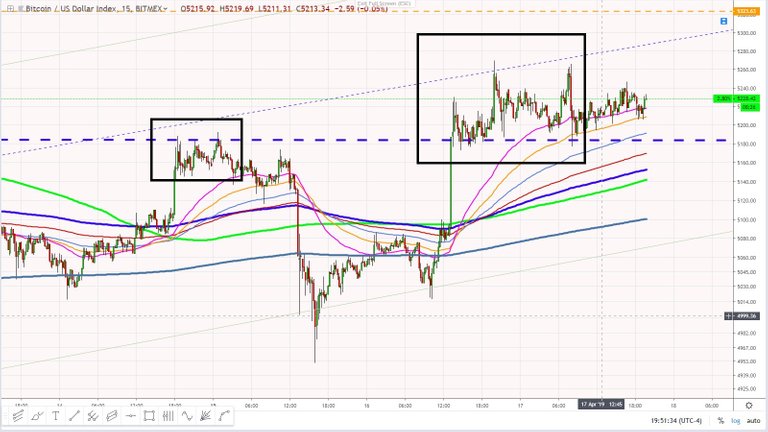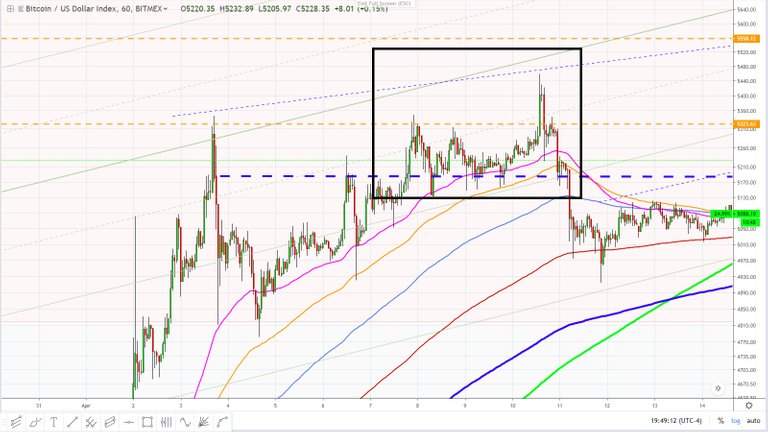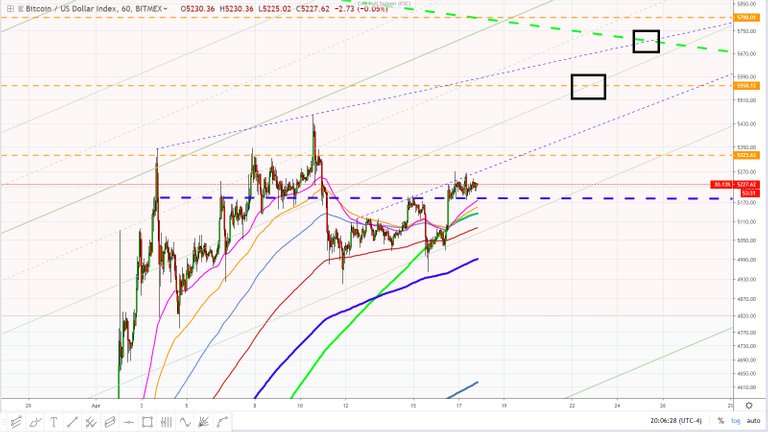

Do you see the similarities in the patterns:
- chart one is a 15 minute chart
- chart two is an hourly chart
- chart three is a daily chart, with potential targets
We could potentially tag a higher level before heading down again (short term of course) the $5555.00 USD range.
The Bots?

All data and information provided is for informational purposes only. Trend Wizard makes no representations as to accuracy, completeness, currentness, suitability, or validity of any information in this post and will not be liable for any errors, omissions, or delays in this information or any losses, injuries, or damages arising from its display or use. All information is provided on an as-is basis. I document this stuff for personal reasons as a log and share with the community...... only because I'm a nice person.
So in ending........ Use critical thinking and think for yourself.