The charts below are patterns of the past. There's 17 charts below comparing the past to today:
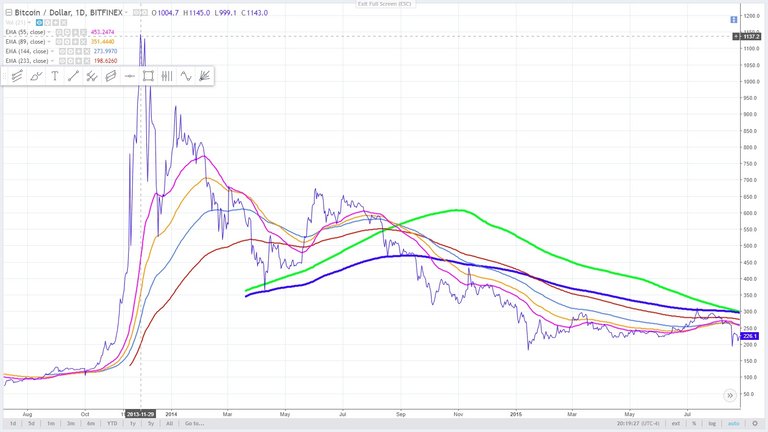
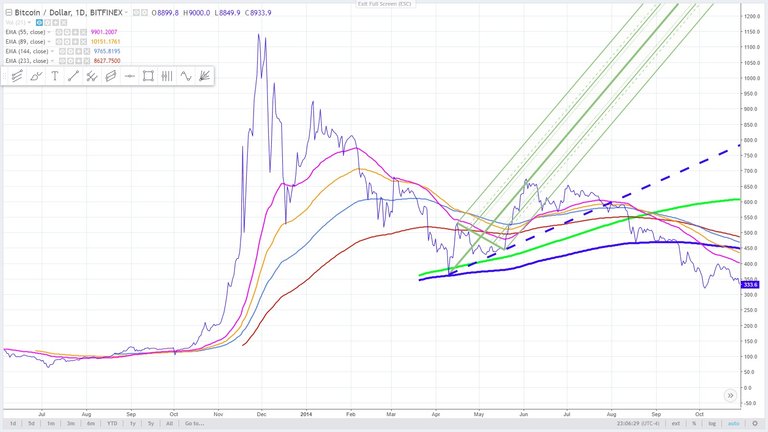
- The high bitcoin made in 2013 to today. Well maybe it compares but what ended up happening was the breakdown of the retest, the B wave. If this is the B wave we're in then it will retest the high and go down into C wave.
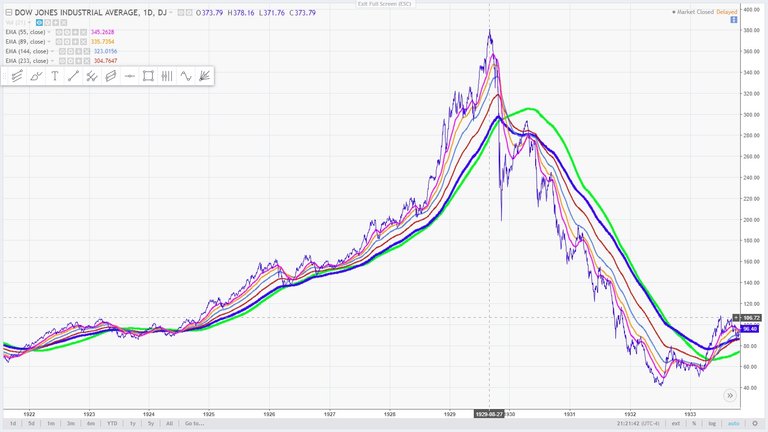
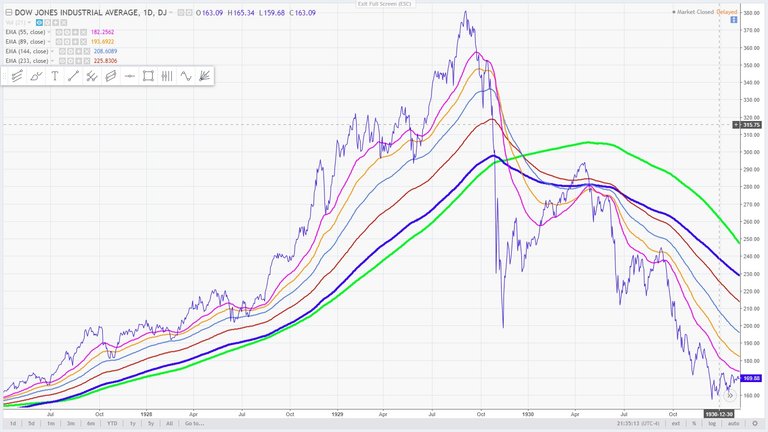
- The high made in Dow Jones in 1929, The price just plunged no support.
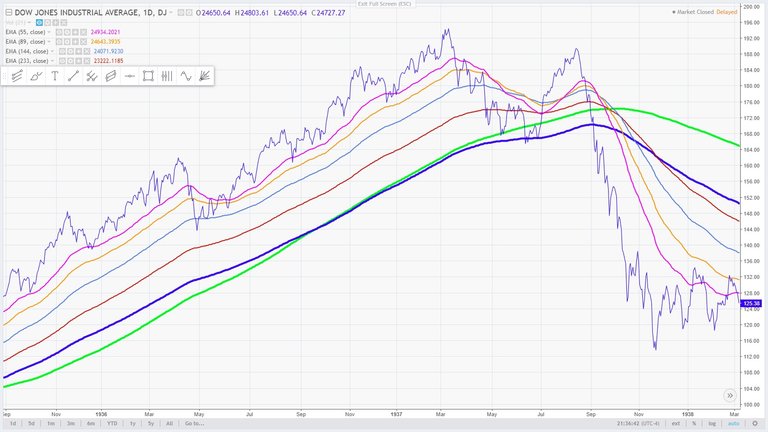
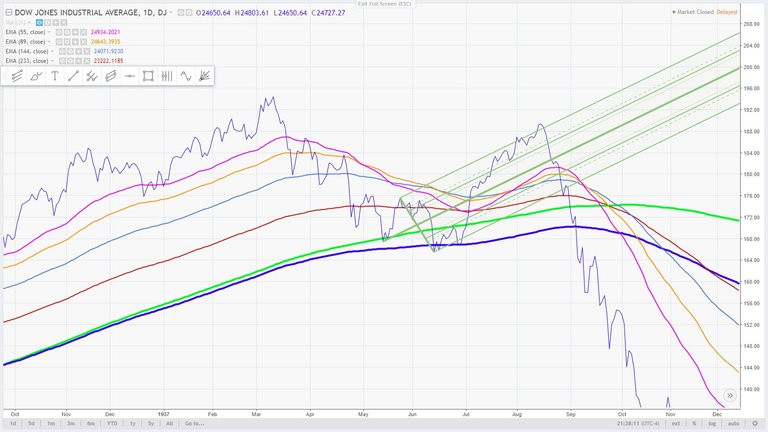
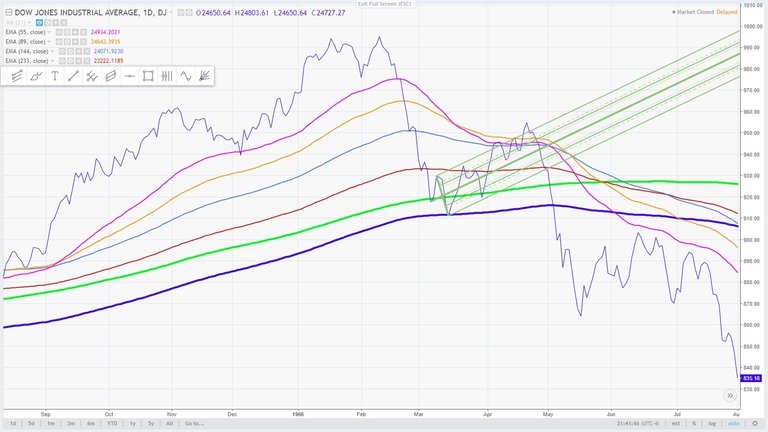
- There were two times in the past when the Dow Jones had a similar pattern as the pattern we're in right now, 1937 and 1966.
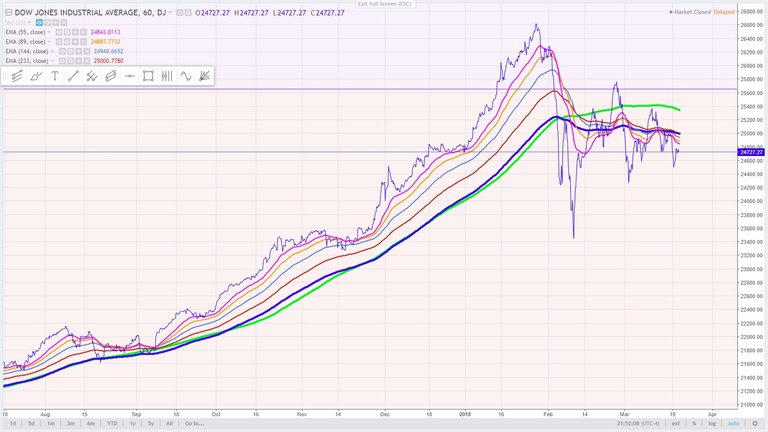
- There's a chart below of the 60 minute bar, I'm not going to say anything about it. You judge.
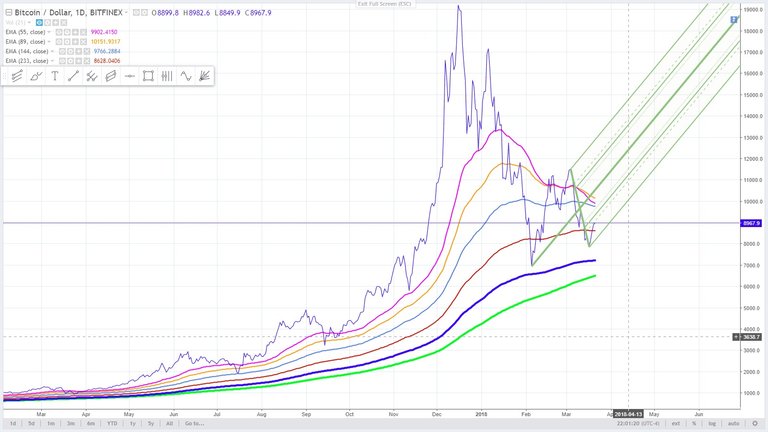
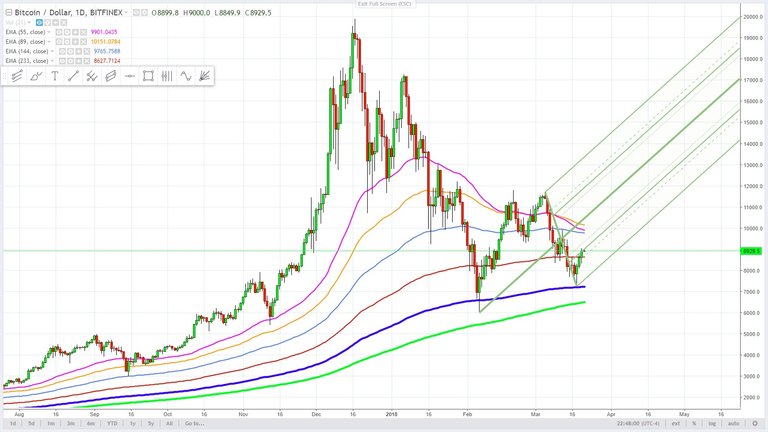
- The last charts are bitcoin today. Is this wave B the retest? or is it possibly wave 4, a consolidation that goes on all year long with massive volatility with a break out to the upside with bitcoin going to more all time highs? or do we just break out to all time high within the confines of the channel in progress. We could just go to all time highs over late spring / summer because the correction we saw from December to present fulfills all the characteristics require for a correction, nothing more needed.
Will have to monitor as usual.
bitcoin November 30, 2013 high
bitcoin November 30, 2013 high with andrews pitchfork
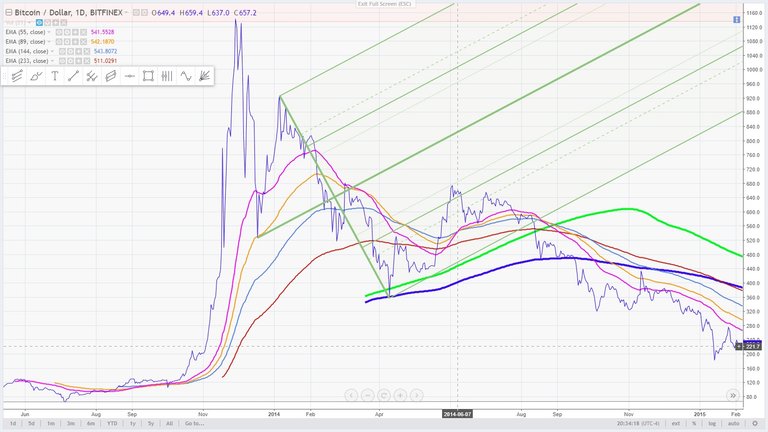
bitcoin November 30, 2013 high with andrews pitchfork with support line and B wave break down going into C wave.
September 3, 1929, the Dow Jones Industrial Average reached a record high of 381.2 compared to the present March 20, 2018
September 3, 1929, the Dow Jones Industrial Average reached a record high of 381.2 compared to the present March 20, 2018
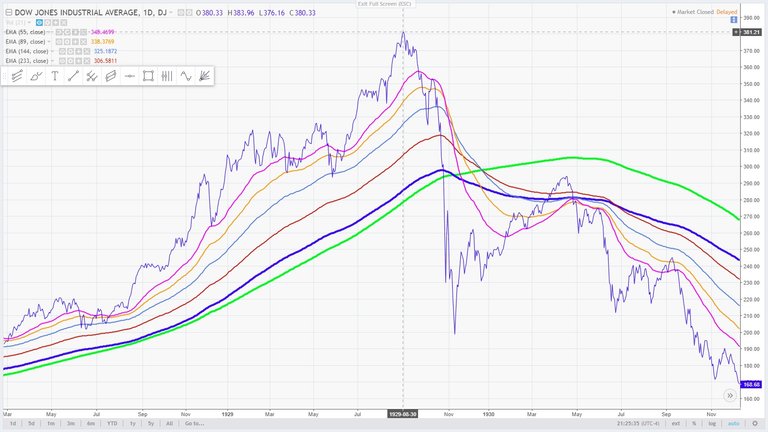
with andrews pitchfork - September 3, 1929, the Dow Jones Industrial Average reached a record high of 381.2 compared to the present March 20, 2018
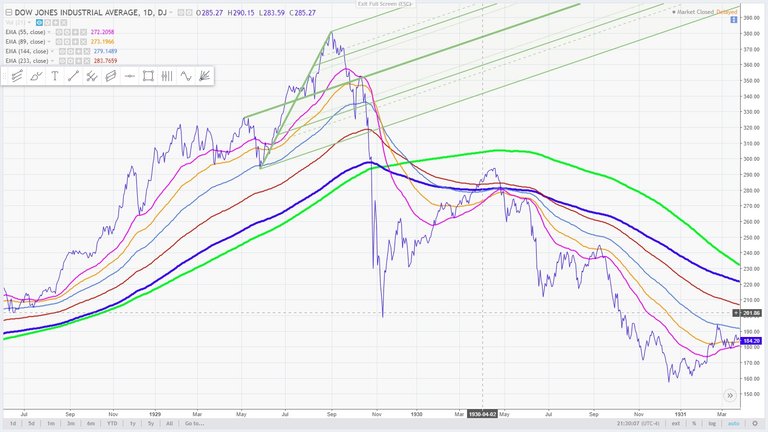
with andrews pitchfork - September 3, 1929, the Dow Jones Industrial Average reached a record high of 381.2 compared to the present March 20, 2018
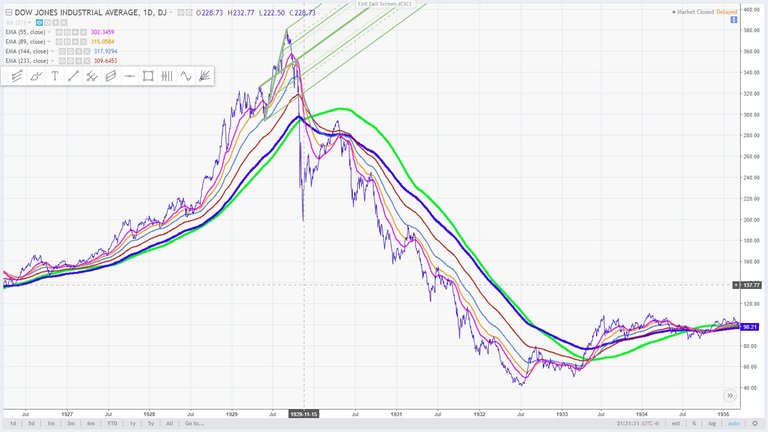
with andrews pitchfork - September 3, 1929, the Dow Jones Industrial Average reached a record high of 381.2 compared to the present March 20, 2018
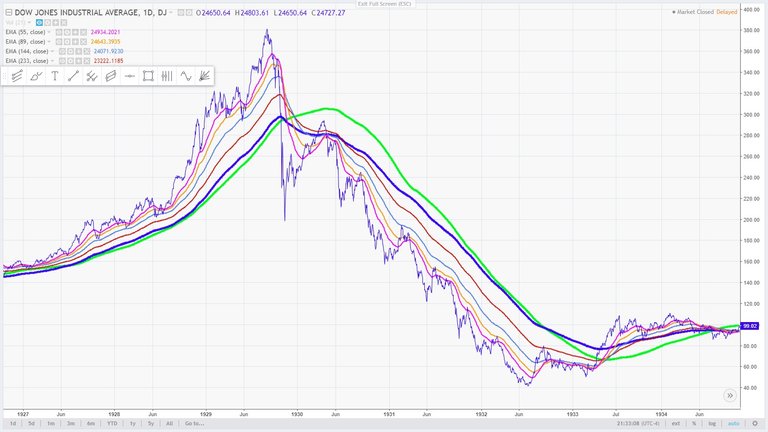
September 3, 1929, the Dow Jones Industrial Average reached a record high of 381.2 compared to the present March 20, 2018
1937 high - the Dow Jones Industrial Average compared to the present March 20, 2018
1937 high with andrews pitchfork - the Dow Jones Industrial Average compared to the present March 20, 2018
1966 high with andrews pitchfork - the Dow Jones Industrial Average compared to the present March 20, 2018
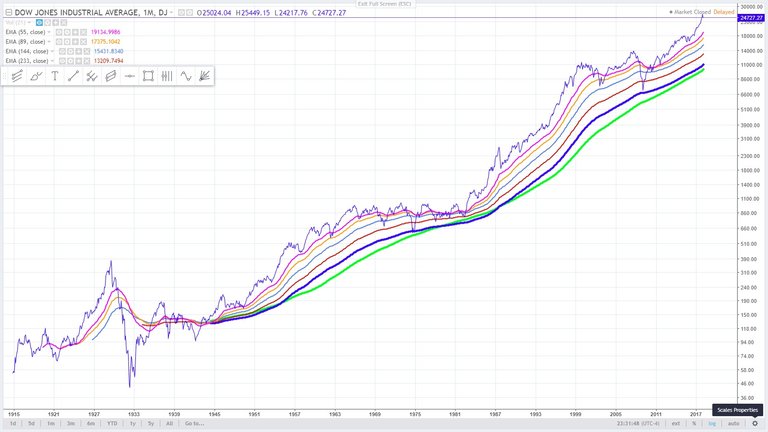
the Dow Jones Industrial Average - Monthly Log chart - compared to the present March 20
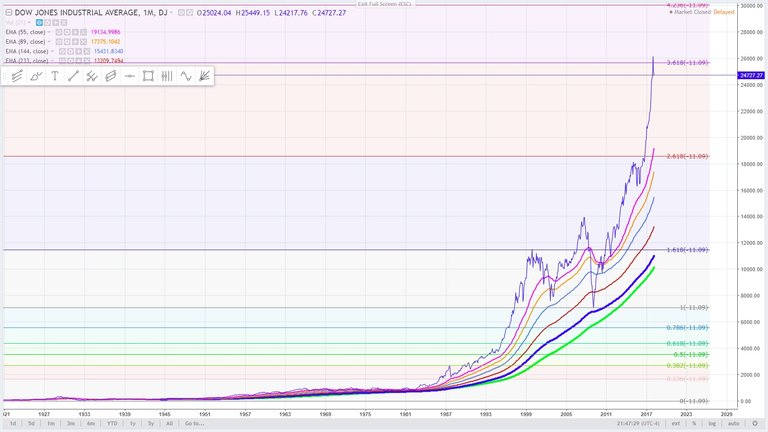
the Dow Jones Industrial Average Monthly arithmetic chart compared to the present March 20, 2018
the Dow Jones Industrial Average 1 hour chart March 20, 2018
bitcoin today
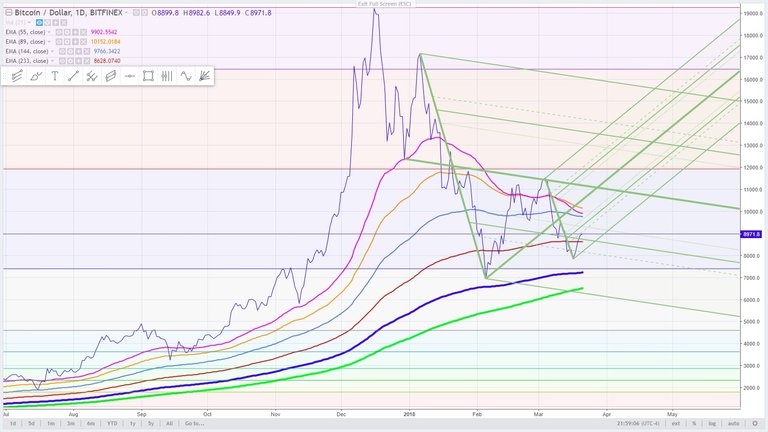
bitcoin present March 20, 2018
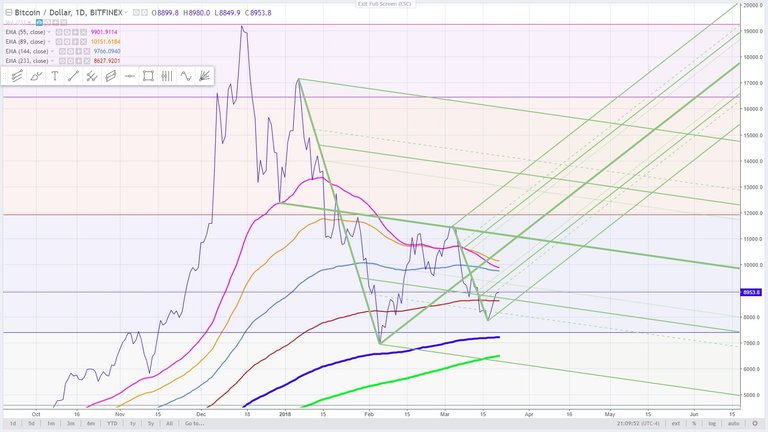
bitcoin today
candle stick - bitcoin Today
All data and information provided is for informational purposes only. Trend Wizard makes no representations as to accuracy, completeness, currentness, suitability, or validity of any information in this post and will not be liable for any errors, omissions, or delays in this information or any losses, injuries, or damages arising from its display or use. All information is provided on an as-is basis.
Ya you bet