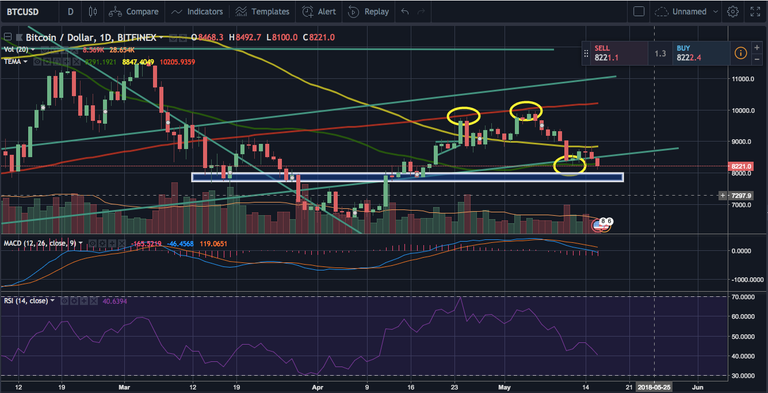
BTC/USD had a great month in April and tried the 200 day moving average on Apr 24 (1st yellow circle) and again on May 5, which was also $10,000 USD/BTC resistance (2nd yellow circle).
Unfortunately, the price didn't break out the resistance and it dropped to the 50 day moving average, which worked as support (3rd yellow circle). Then, it tried to climb up to the 100 day moving average but rejected. The price is currently under the 50 day moving average today (green line).
50 day moving average as key support
If daily chart is complete below the 50 day moving average, the price could go to the next support level, which is $7,800 - $8,000 USD/BTC (blue region). RSI still has some room to go (below 30 is oversold) so this scenario is totally possible.
The worst case scenario
The worst case scenario is to break down to the previous bottom, which is ~ $6,500 but I don't think this would happen unless we hear very bad fundamental news.
Optimistic scenario
If daily chart is complete above the 50 day moving average, then the price could challenge the 100 day moving average again soon (yellow line).
Please upvote and follow me if you enjoyed reading the post.
Disclaimer : I am not a certified financial advisor. This post is just my personal opinion and not financial advice. Please do your own research and do not trade just based on my posts.