Bearish View:
I have observed 2 major areas of confluence in Bitcoin currently:
1. The .786 Fibonacci line is around $7200 zone. I get the $7200 from the two points 6k and 11.8k (see chart)
2. The falling wedge is drawing out a ABCDE pattern with the point E finishing almost directly on $7200 zone
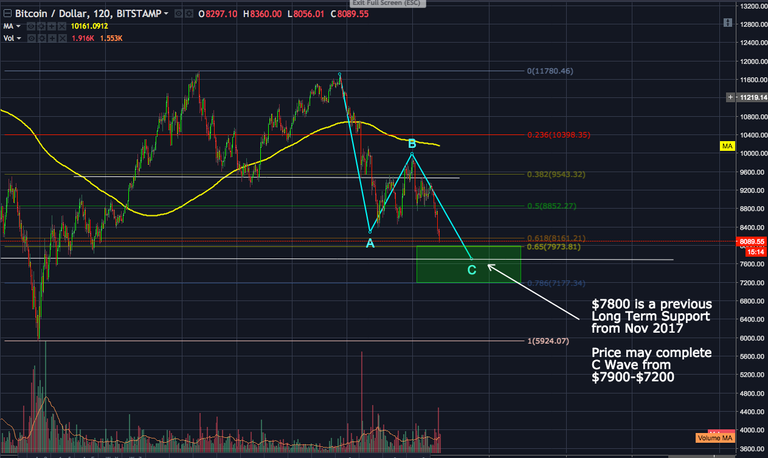
Finally, if we are finishing a final Elliot C Wave (see second chart), it seems that the 3rd sub wave will hit around $7800 and the 5th subwave will hit around $7200.
Chart 1
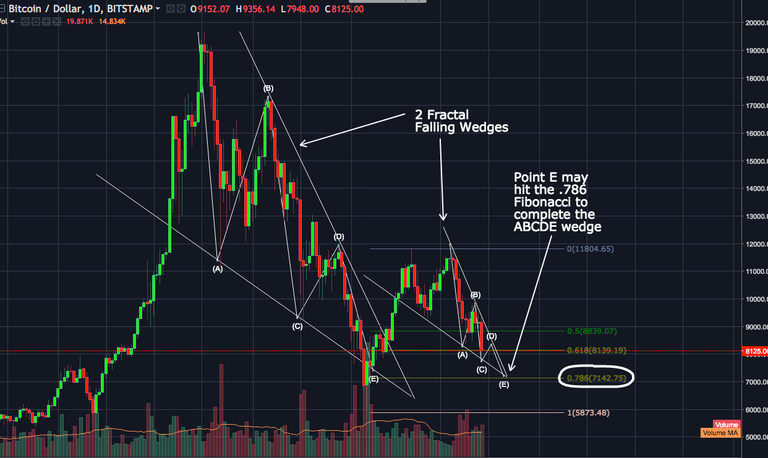
Chart 2
Conclusion:
Bitcoin may be completing a Wave 2 at $7200, which may be Bullish. If Wave 2 is completing at $7200 then we may see Wave 3 go up to the 1.618 Fib or $17000 zone and if Wave 3 is the same length as Wave 1 then we will see a a $12500 zone.
Most likely, if we are completing a Wave C then we should see price action completing in $7800-$7200 zone.
In my next post I'll show a bigger picture Bear scenario so you are aware of it.
If you like my bitcoin updates and would like to see more posts daily then please upvote this post and i will know my posts are valuable to you.
Stay tuned...
Legal Disclaimer: This post is in no way giving financial advice. This post is only for entertainment purposes and anyone reading this should do their own research before making any financial decisions.