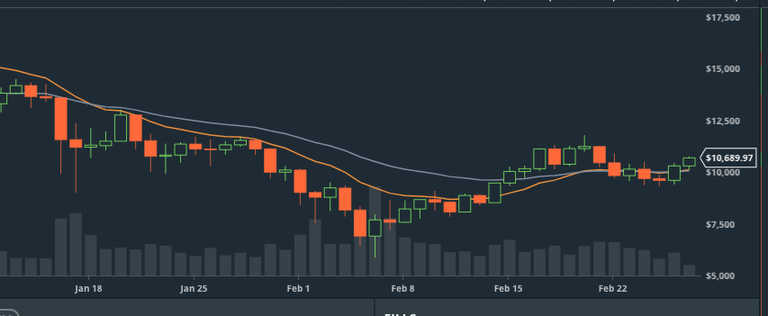
I have a question, this is from Gdax and I noticed the EMA lines are running together if you look at it on the monthly chart. On the weekly they come closer together and cross. Could you give me any insight on that?

I have a question, this is from Gdax and I noticed the EMA lines are running together if you look at it on the monthly chart. On the weekly they come closer together and cross. Could you give me any insight on that?
