While we're slowly chopping in this bearish environment, one can't but dream of the time when our beloved Bitcoin will strike through the $20k mark and moon once again towards new records. Sadly, reality is often crueler than one's hope, and if the past is of anything of worth, then the immediate future still looks glum.
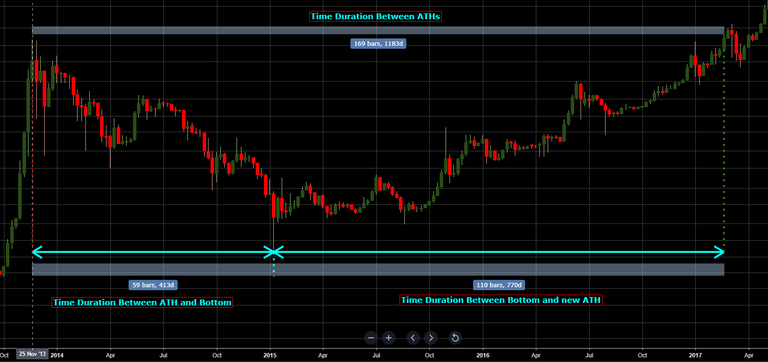
What I did was to just check out of curiosity what was the time duration between surpassing the all-time highs after the previous bear market of 2014/15. Then I checked the ratio between what became bottom and the aforementioned ATHs. What I got is this:

OK. It took well over 3 years to get to another ATH after the bear market. What's more, the recovery after hitting the bottom was much more prolonged than the drop itself. Now, those numbers (no. of days) can't really make much for an analogy, but what I do see relevant is using the percentage rate.
So, if it took 413 days to get to the bottom, and 1183 days to hit a new high, then the road down is 35% and the road back up is 65% of the total journey. Sounds fair enough, after a parabolic run there's not much support to stop you, whereas on the way back up you can't avoid bumping into resistances which delay you.
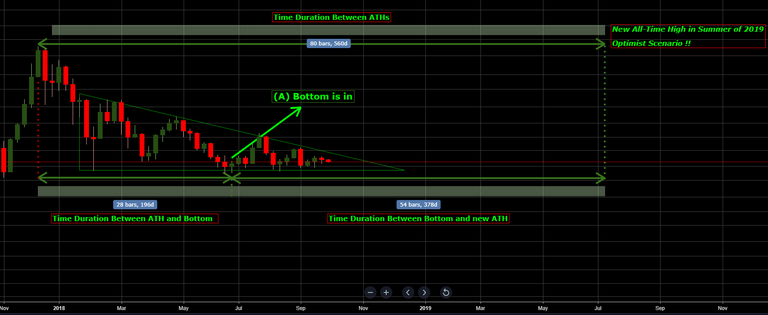
Now, nobody knows IF the bottom is in. But, just for the sake of this comparison, I'm going to use the most optimistic scenario possible - let's call it scenario (A). We take the bottom of late June ($5774 on Bitstamp) and apply to it this rationale.

And the result is not looking pretty. So assuming that we struck bottom over 3 months ago and that now we are in recovery mode, if we get back up at the same rate as in 2015/16, we won't touch the $20k mark before next summer! And what's worse, this is the most optimistic scenario conceivable!