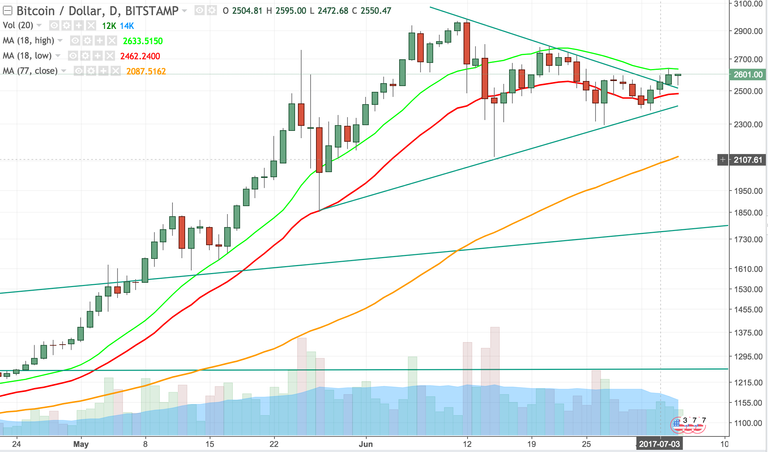
The BTC chart looks quite bullish. We broke out of the triangle formation to the top and are on the way to the 18 moving average (MA) of highs (green line). We have tested the upper side of the triangle, which held successfully. We have seen a pattern of higher highs and now a break over the last high. It is too early to declare the win of the bulls, but the chart is looking strong.
Another positive factor may be the psychology of the market, we have seen quite a bit of panicking and weak hands selling in the last correction. With the recent strength, it may be the case that people are jumping on the train now, as they dont want to miss the next rally, leading to quick up moves.
Because of the uncertainty in the fundamentals (BP148), I do not see a fast break of the All time high, but a sideways movement, with one or two challenges to the ATH, to be broken end of July/early August, when the BIP148 topic is off the table.!

Beautiful writeup!Thanks for sharing.@vossi88
good points, but play it save make sure cut loss wisely. followed n upvoted
Nailed it! BTC tanking down to $1,835 LOL