Thanks, @lordoftruth, for spotting this Fibonacci turning point and for posting this Alert for serious Bitcoin traders.
New to Fibonacci Trend Analysis? Check out this chart and the link below it for a more detailed study.
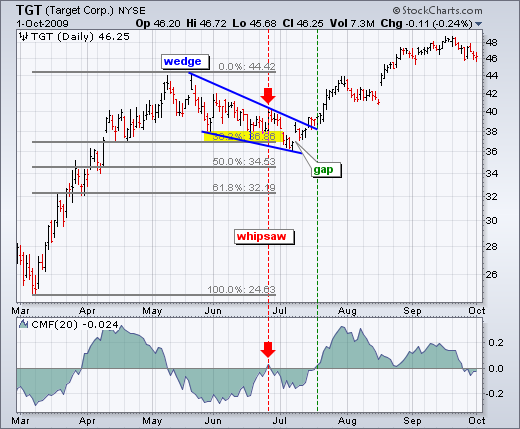
[paraphrased from the article] 'This Chart shows a stock with a moderate 38% retracement and other signals coming together. After declining around 38%, the stock bounced back. In addition to the 38% retracement, notice that broken support turned into resistance in this area.'
From the introduction of this article > "Fibonacci Retracements are ratios used to identify potential reversal levels. These ratios are found in the Fibonacci sequence. The most popular Fibonacci Retracements are 61.8% and 38.2%. Note that 38.2% is often rounded to 38% and 61.8 is rounded to 62%. After an advance, chartists apply Fibonacci ratios to define retracement levels and forecast the extent of a correction or pullback. Fibonacci Retracements can also be applied after a decline to forecast the length of a counter-trend bounce. These retracements can be combined with other indicators and price patterns to create an overall strategy."
Here's the link > http://stockcharts.com/school/doku.php?id=chart_school:chart_analysis:fibonacci_retracemen
Thanks, @lordoftruth, for spotting this Fibonacci turning point and for posting this Alert for serious Bitcoin traders.