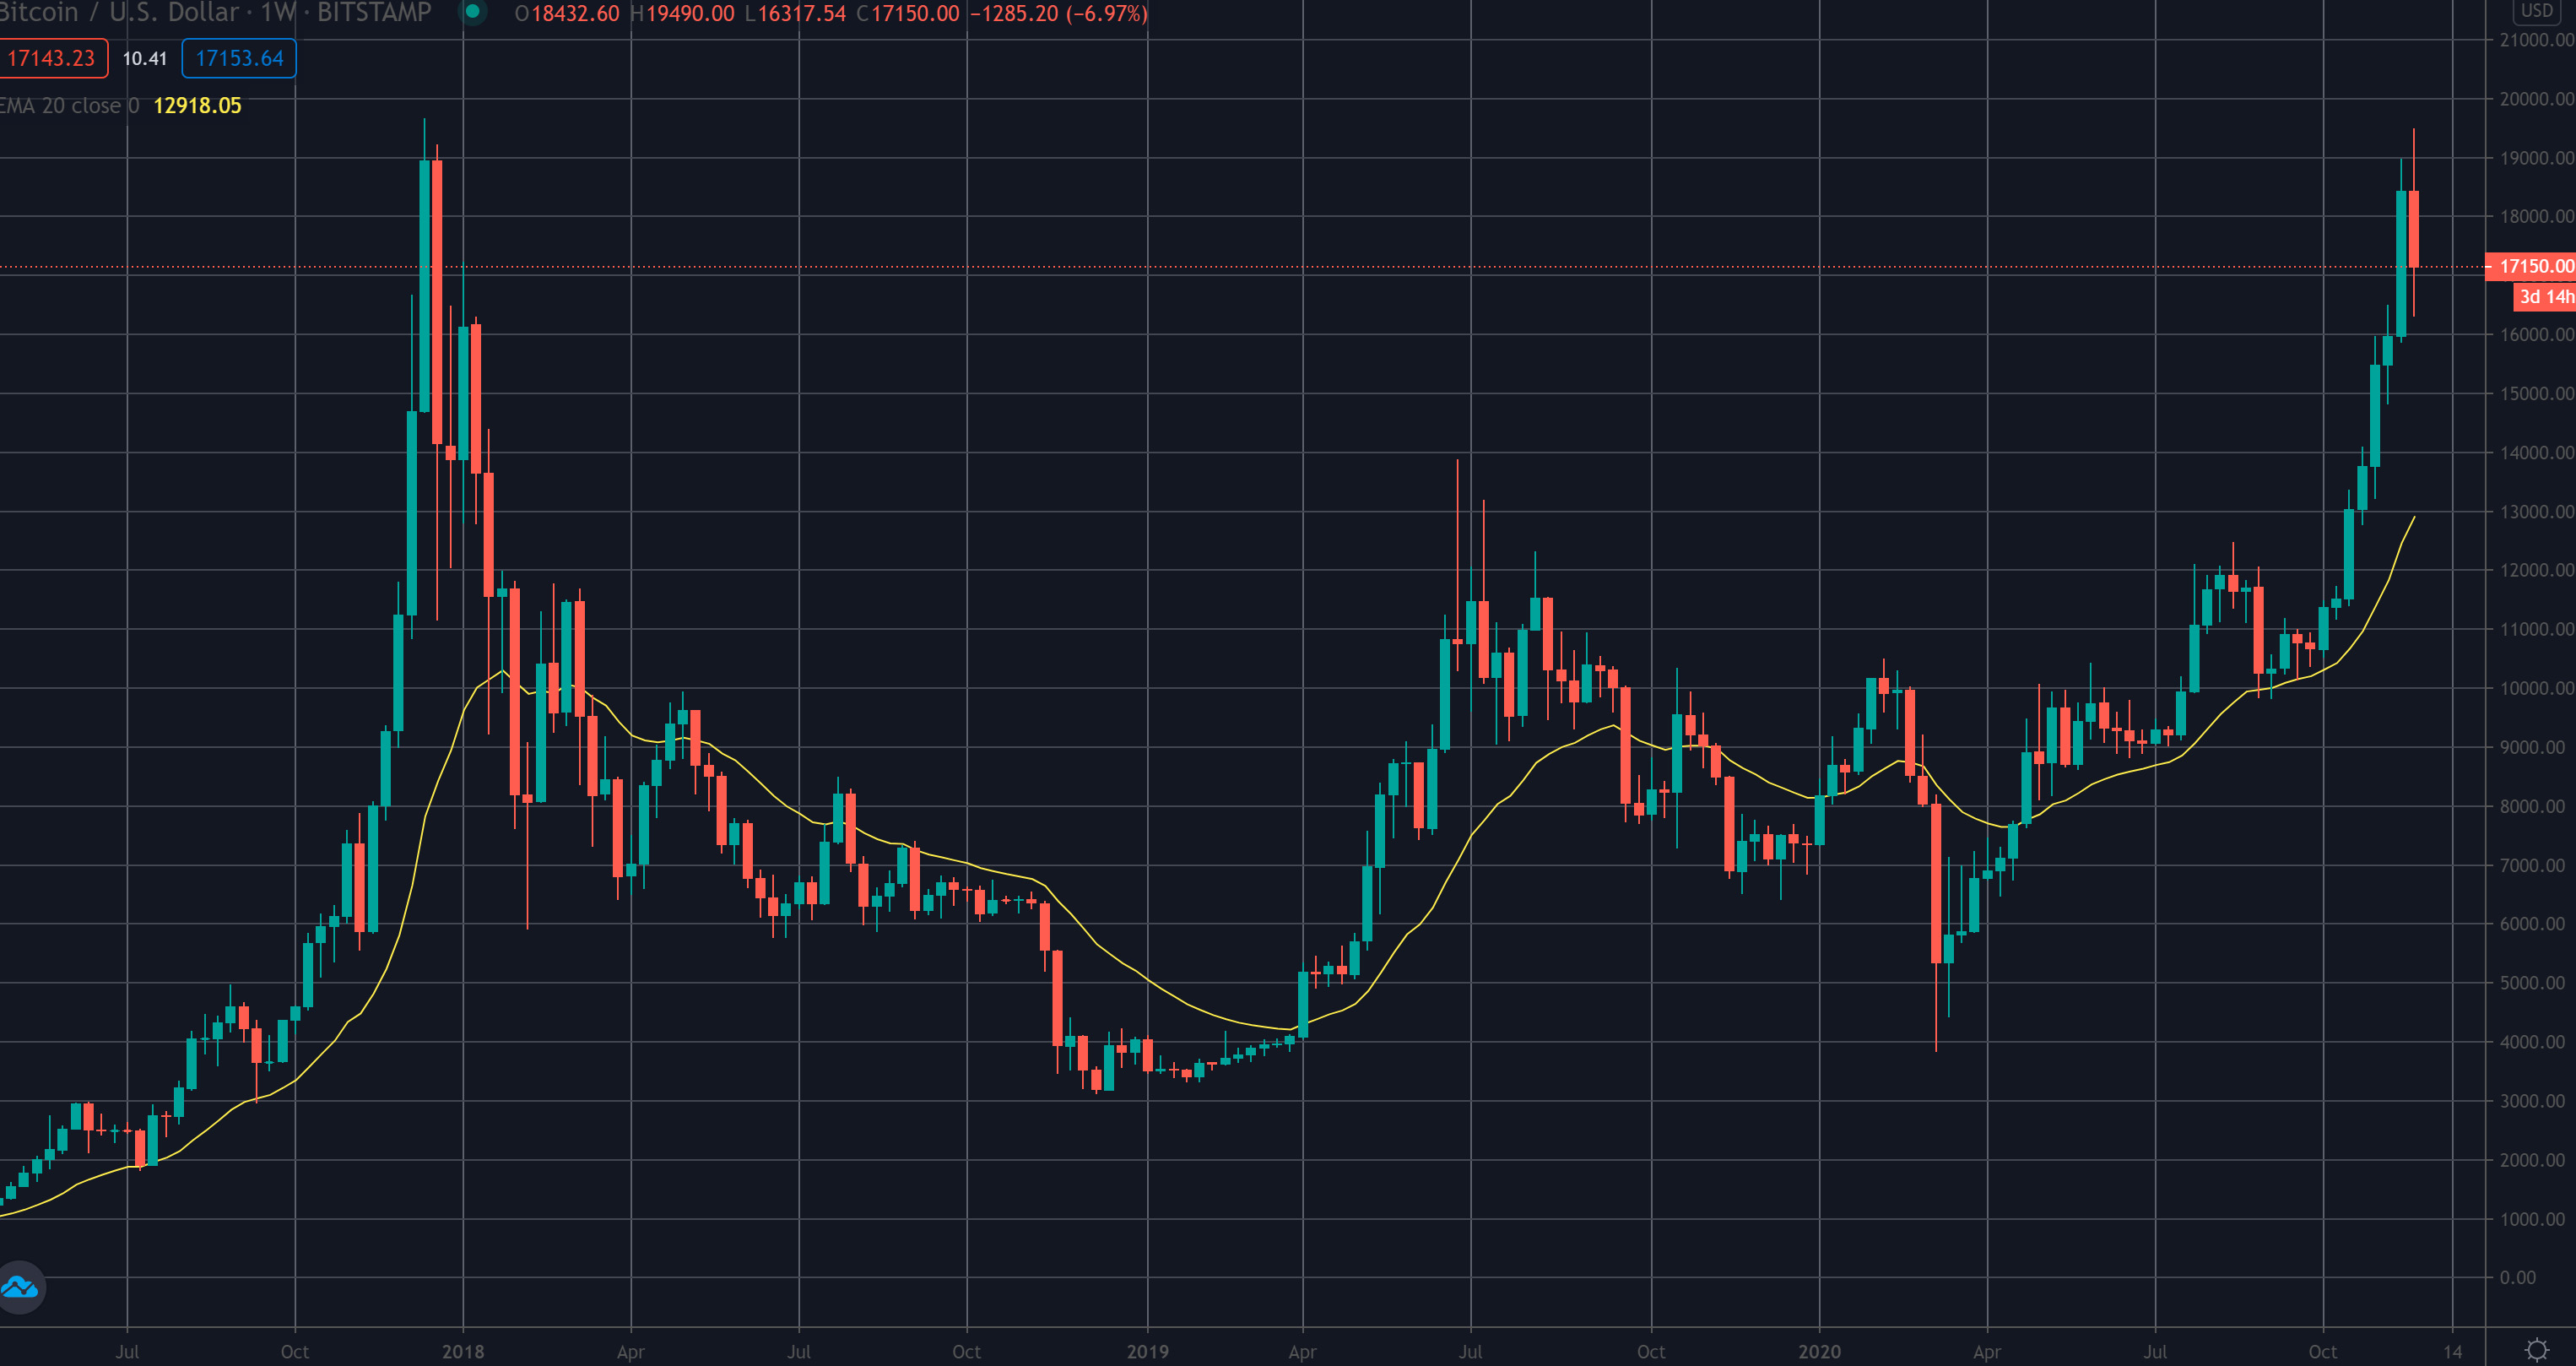
I've seen so many people talking about Bitcoin price needing to pull back to the 20 day moving average recently. It's the yellow line on this chart. If you look at the 2017 bull market, on the far left, it did keep pulling back, until the last crazy surge to $20k. What I find interesting this time is how close we got to an all-time high. I thought surely that has to go before a pull back? Going to be interesting to see what happens now. Is this just a bear trap, before 20k breaks or is the pull back to the 20 day moving average going to happen now?
I don't trade it, just hold it, as my timing is always wrong :)
Congratulations @wayoutwest! You have completed the following achievement on the Hive blockchain and have been rewarded with new badge(s) :
You can view your badges on your board and compare yourself to others in the Ranking
If you no longer want to receive notifications, reply to this comment with the word
STOP