
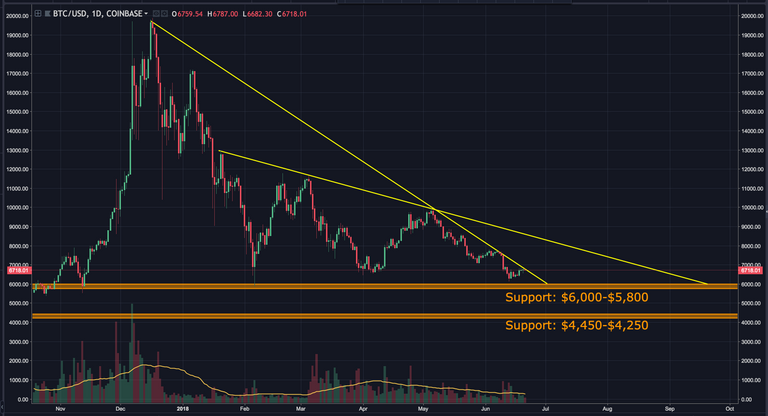
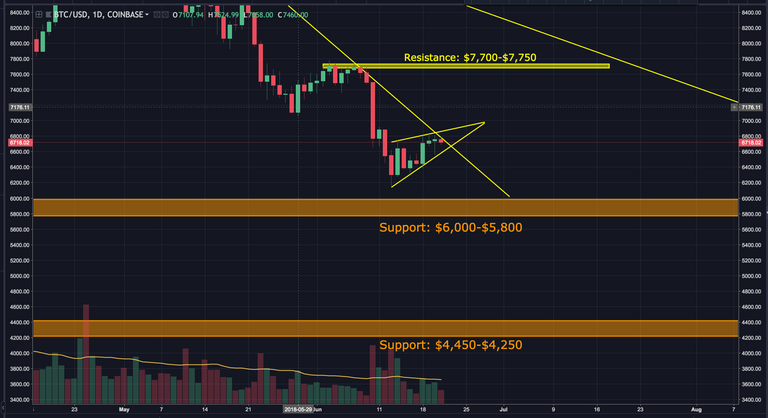
Looking at the 1 day chart, we can see Bitcoin is still struggling to break above the descending resistance line. It can't continue this way much longer. It's either going to breakout, or break down.
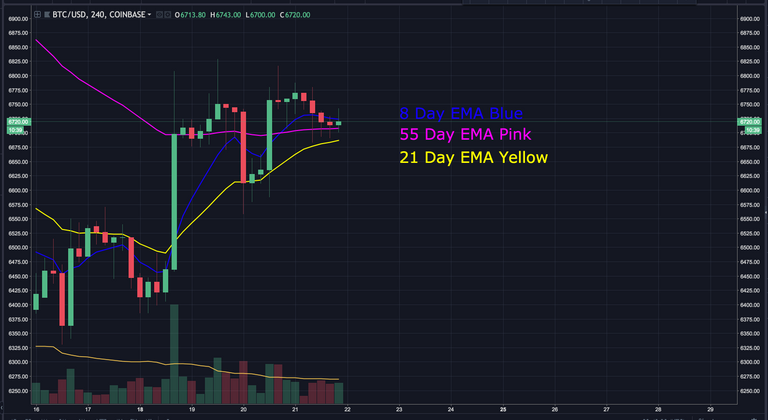
The 4 hour chart shows the 55 day EMA is acting as support. The bulls need this to hold. A break below may indicate the start of a major downtrend.
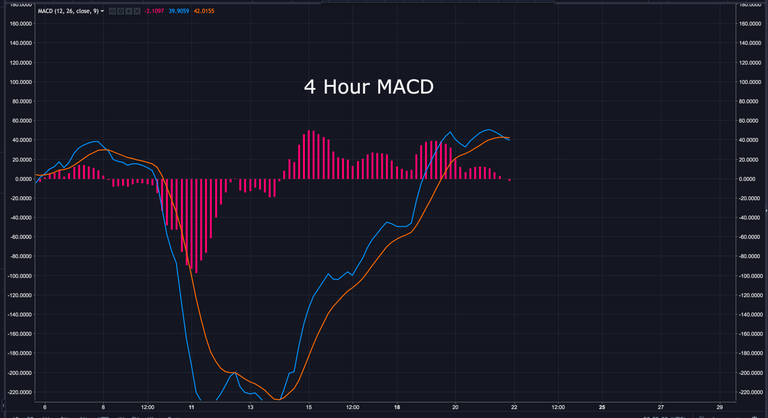
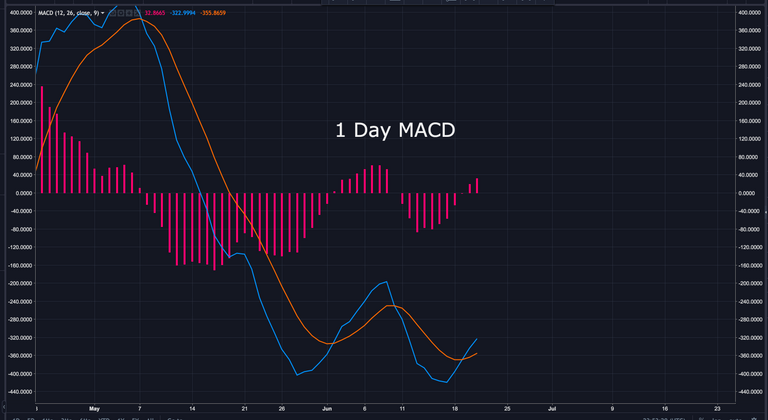
The 4 hour MACD has just crossed over into bearish territory. However, the 1 day MACD remains relatively bullish looking for now.
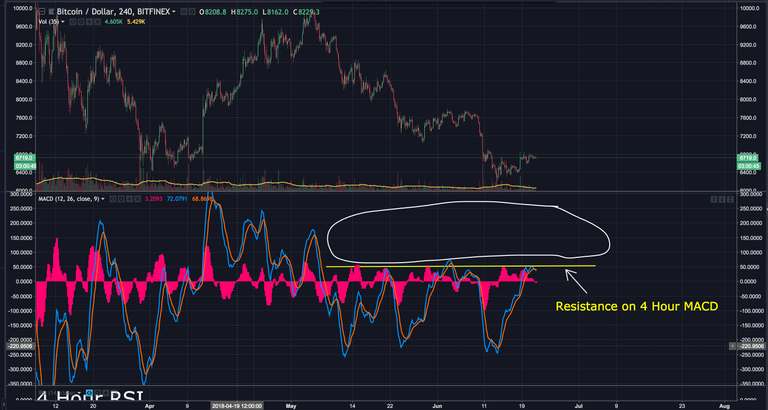
Zooming out on the 4 hour chart, we can see the MACD trend line hasn't broken above 53 during this latest downtrend. We need to see this resistance broken if the bullish count is to be validated.
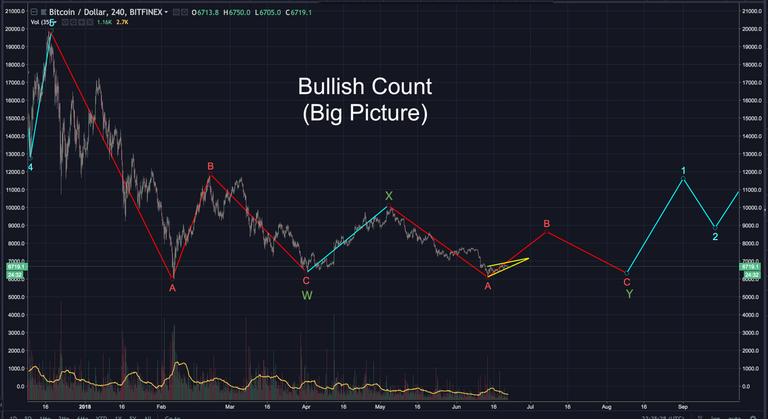
My bullish and bearish count remain the same.
If bitcoin breaks up, I believe it's in wave B of an ABC correction, within a larger WXY pattern.
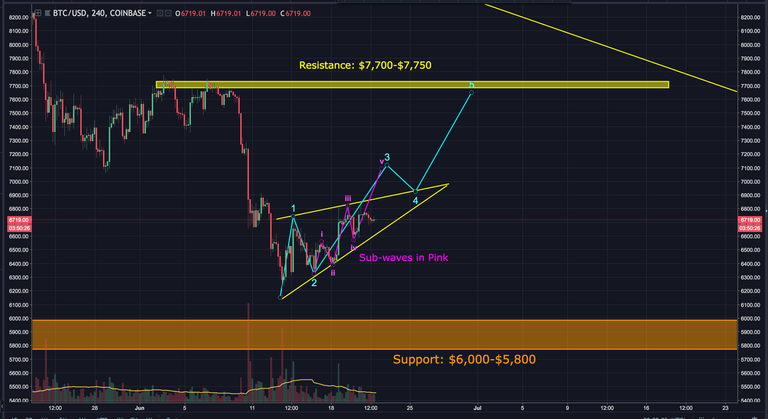
Zooming in, we can see the bullish scenario would have bitcoin in a smaller wave 3 of 5 waves up. The sub-waves are highlighted in pink.
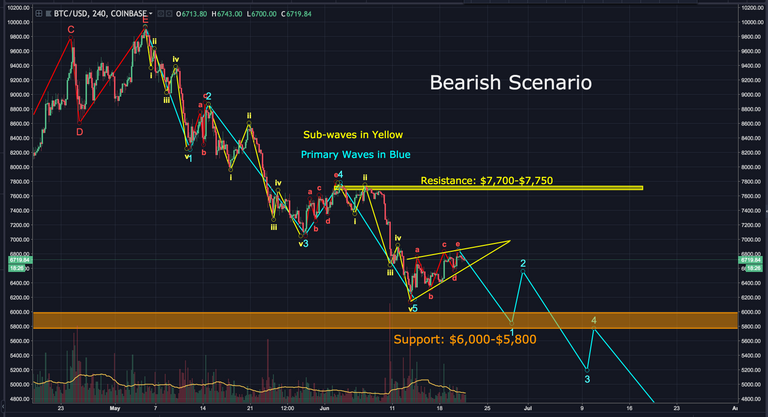
If bitcoin breaks down, it will have likely just completed an ABCDE correction, and began wave 1 of 5 waves down. If this count is accurate, bitcoin would still need to break through a strong support zone between $6,000 and $5,800. If this support fails, we'll likely see bitcoin drop to around $5,000.
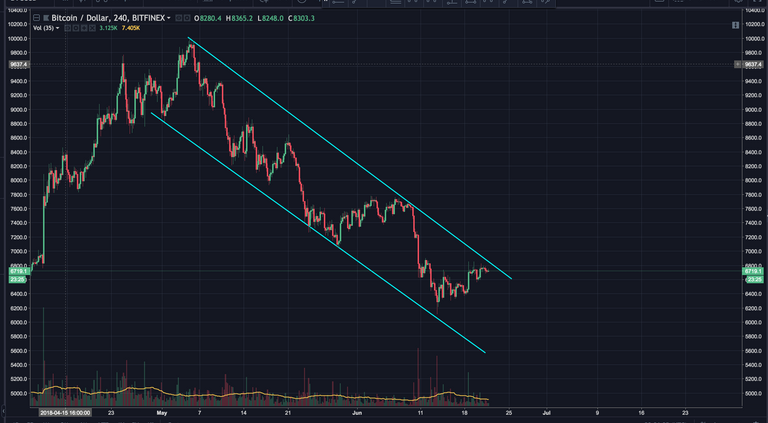
Bitcoin is still operating within a descending channel. If the bullish count is to be validated, we need to see it break out of this channel with the next 24-48 hours.
Let's see how the next 24-48 hours unfold.
BIAS:
Short Term: Neutral
Longterm: Very Bullish
I hope this has been helpful. I’d be happy to answer any questions in the comment section below. Thanks for stopping by.
If you found this post informative, please:

If you don’t have an account on Binance, I STRONGLY recommend getting one. They’re usually the first to get reputable coins, have excellent security and second to none customer service. You can sign up here free of charge: https://www.binance.com/?ref=16878853
FYI…I just started a Facebook and twitter page where I’ll post analysis, along with other relevant crypto data from myself and others. If you’d like to be notified as soon as updates reach Steemit, the twitter handle is @Workin2005 and the Facebook page is https://www.facebook.com/Workin2005/
Published on

by Workin2005


Out with the bullish scenario, looks like Bitcoin is irrevocably headed lower. Excellent work. What in your opinion will stem the red tide? Fundamentals must have some effect. Maybe Bill Gates took Tyler Winklevoss's suggestion (Tweet) and decided to short Bitcoin?
I think the drop is a combination of things.
For the last year we watched a market propped up on major manipulation. When the bubble burst, and it went from $20K down to $5,800, it was immediately propped back up to $11K through more manipulation. In other words, $5,800 was NOT a true bottom. Now, that the Department of Justice is investigating price manipulation, the manipulators are cashing out. With no more (or very little) manipulation to prop up the market, we're now going to see the REAL bottom we should’ve seen back in January.
There are other factors as well. The SEC still hasn’t outlined clear regulatory guidelines. Until this happens, we won’t see any new money enter the market. The good news is, once the market does bottom out, and we have the regulatory framework in place, I believe we’ll see a bull run that’ll be sustainable for years.