
Bitcoin's been able to hang on to it's gains over the past 24 hours. It's now reaching a few key resistance points. Getting through these points will be a real test of strength.
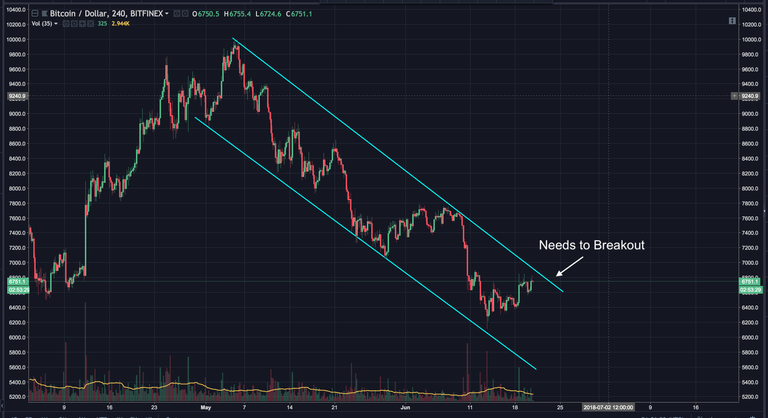
Bitcoin's approaching the edge of the downward channel it's been operating in for the last month and a half. It needs to break out of this channel to confirm a bullish trend change.
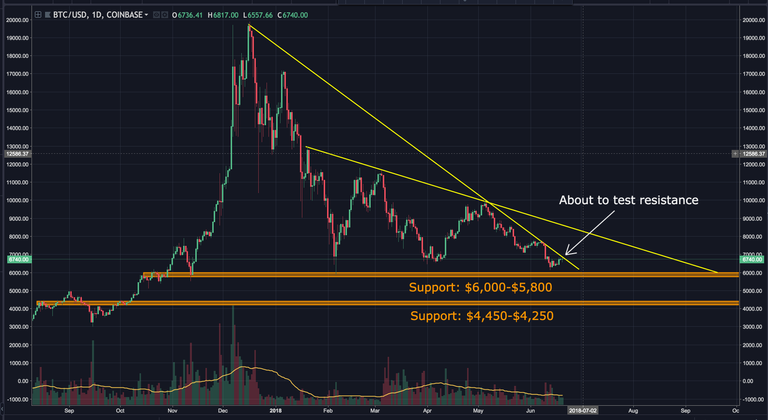
Looking at the daily chart, we can see bitcoin is also approaching the larger descending resistance line. It tried to break this line, but failed 2 weeks ago. As of now, volume is weak. We need to see a major increase in volume if bitcoin is going to break through.
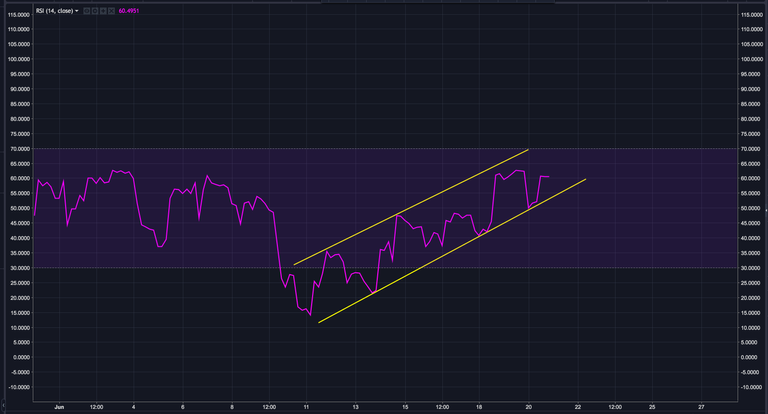
The 4 hour RSI remains very bullish looking. It's been operating in a steady rising channel for the past 10 days.
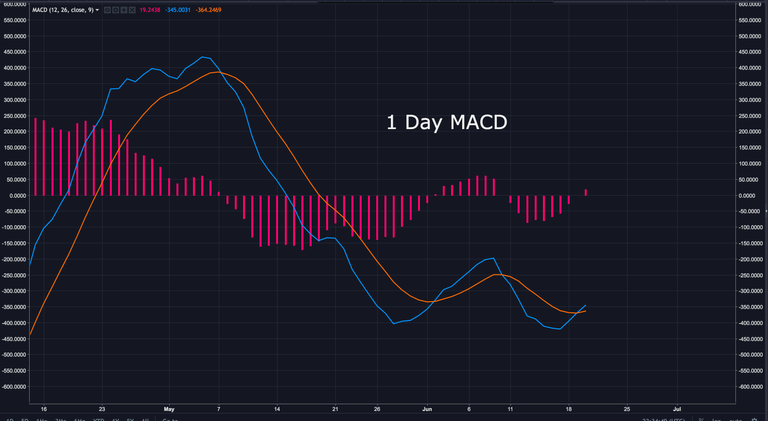
The 1 day MACD has just crossed over into bullish territory.
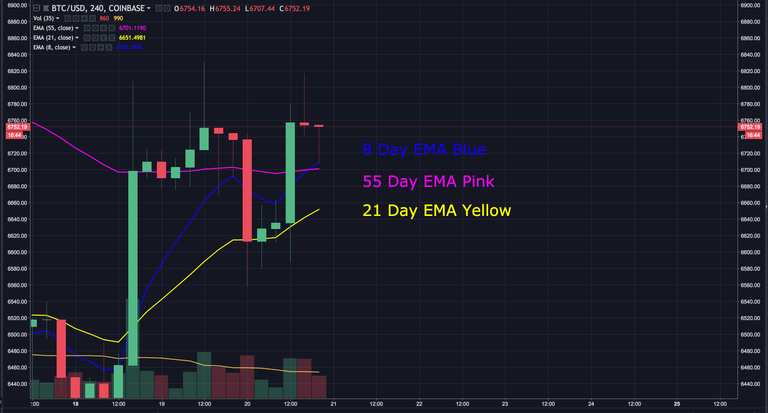
Looking at the 4 hour chart, we can see the the 8 day EMA has just crossed above the 55 day EMA. This is a very bullish sign of strength.
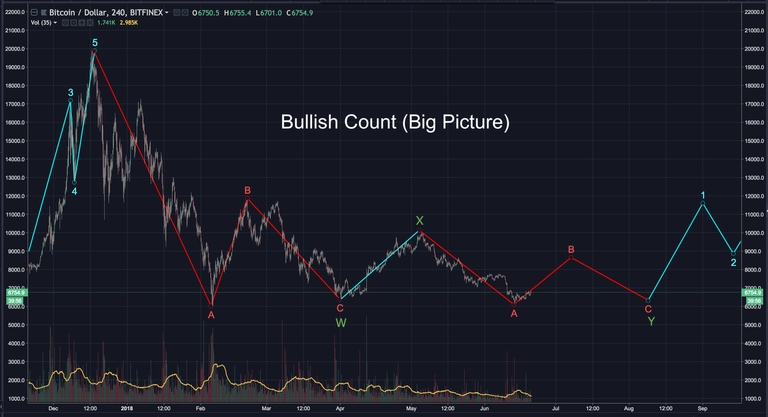
Looking at the bigger picture, my bullish count has us in a second ABC correction within a WXY pattern. If accurate, bitcoin is just beginning wave B.
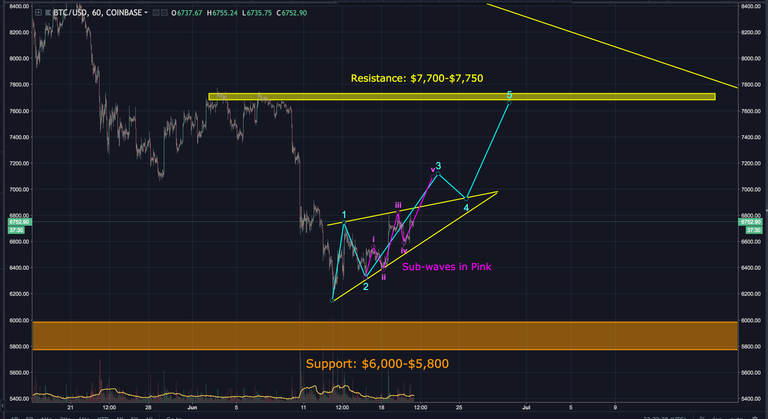
Zooming at the 1 hour chart, we can see bitcoin has been operating within a wedge. There are a few ways to count this price movement over the last few weeks. My bullish count has BTC completing wave 3, of 5 waves up. I've highlighted the sub-waves in pink.
As much as I'd like to only consider bullish possibilities, we must acknowledge a bearish count that's still in play. This bearish count has bitcoin just completing an ABCDE correction. If correct, we can expect 5 waves down. Here's how it may play out:
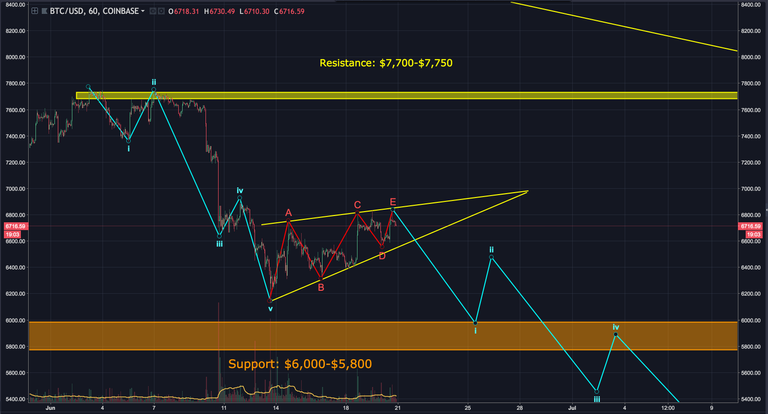
Zooming out on the 4 hour chart, I've labeled the sub-waves in yellow for this possible bearish scenario.
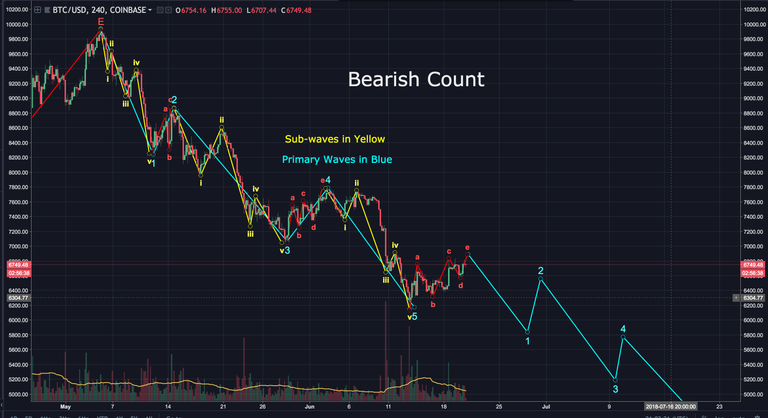
Let's see how the next 24 hours unfold.
BIAS:
Short Term:Neutral
Longterm: Very Bullish
I hope this has been helpful. I’d be happy to answer any questions in the comment section below. Thanks for stopping by.
If you found this post informative, please:

If you don’t have an account on Binance, I STRONGLY recommend getting one. They’re usually the first to get reputable coins, have excellent security and second to none customer service. You can sign up here free of charge: https://www.binance.com/?ref=16878853
FYI…I just started a Facebook and twitter page where I’ll post analysis, along with other relevant crypto data from myself and others. If you’d like to be notified as soon as updates reach Steemit, the twitter handle is @Workin2005 and the Facebook page is https://www.facebook.com/Workin2005/
Published on

by Workin2005

well written and i think Binance is amazing too
Good job. Upvoted.
Thanks
As much as i want it to be bullish, the bearish count seem more logical right now.
This correction is taking too long ugh