Bitcoin has continued it's downfall after getting rejected two times from $11.698 resistance level and hasn't been able to find support zone to recover from.
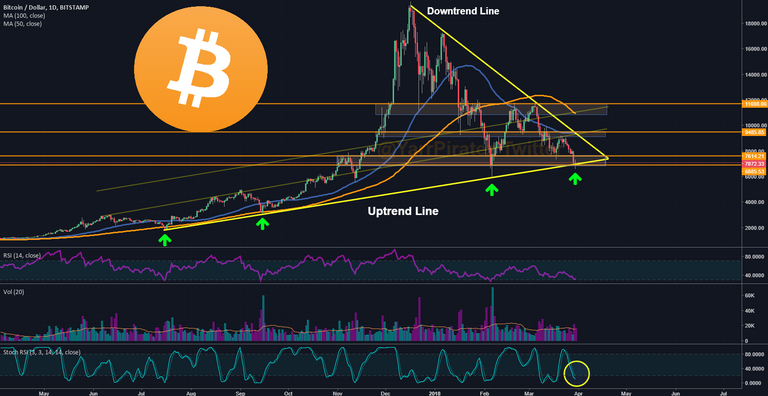
Last night was a real fight between bulls and bears. At the moment the price is hovering above of the major uptrend line which has acted as a reversal point in the past and what is important is that it is inside of a strong support zone. The good side is that the support area is holding for now.
[Image 1]
First image
This is by far the longest uptrend support line in the history of bitcoin and has held even in the worst scenarios. Stoch RSI enters oversold position and is indicating that sell momentum is becoming to it's end. To confirm of momentum changing from sellers to buyers is that when this momentum indicator starts pointing up and volume starts expanding.
[Image 2]
Second image
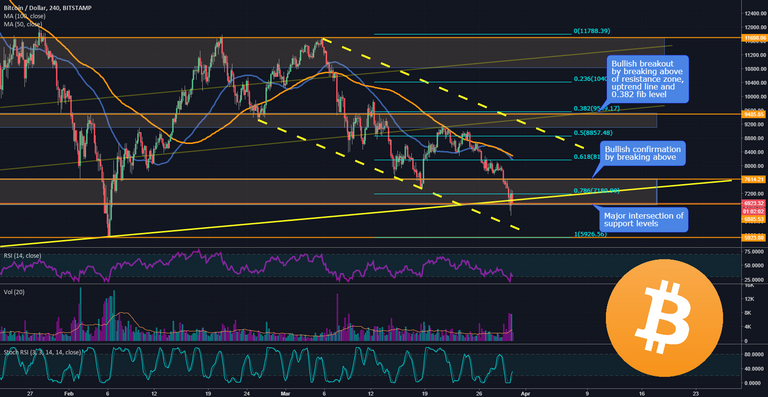
is a good example of what bitcoin needs to see before recovering from this dip and turning in to bullish.
- 0.786 is acting as a resistance level and the daily candle needs to close above of this. Also by breaking above $7.600 level would signal that it wants to move higher.
- Breaching through of moving averages is another signal for a price trying to push higher.
- The biggest confirmation is that when it manages to break above of 0.383 fibonacci level, resistance zone and a uptrend line found close to it.
[Image 3]
Third image
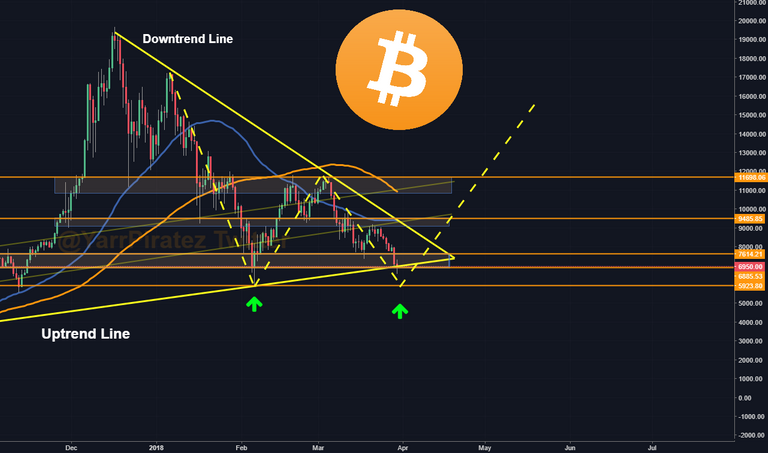
shows a double bottom formation. What is a double bottom pattern?
Quoted from investopedia:
A double bottom is a charting pattern used in technical analysis. It describes the drop of a stock or index, a rebound, another drop to the same or similar level as the original drop, and finally another rebound. The double bottom looks like the letter "W". The twice-touched low is considered a support level.
If it does not manage to hold strong support levels, then I would look at the next support at the $5923 level for possible reversals. This should form a clear double bottom pattern.
Conclusion
If bitcoin does not manage to hold key support area which is mainly formed by a lower uptrend line and a support zone, then it's likely to move further down. The chart is starting to favor more bullish sentiment. Minor pullbacks can be expected before moving upwards.
It's not looking that terrible anymore and it's important to wait until further confirmations.
Relax, zoom out and don't panic! ;)
DISCLAIMER:
Please be aware this is not financial advice. You are responsible for your trading and investing decisions. It is highly recommended to do your own research before investing anything.

My list of trading tutorials
Please consider upvoting if it has helped
More coming soon!
Lesson 1 - Beginner's Guide: How to use Moving Averages to Day Trade?
Twitter - http://twitter.com/YarrPiratez
Telegram - http://t.me/YarrPiratez Crypto Signals & News
Telegram - http://t.me/YarrChat Coin Chat Room
Trading View - https://www.tradingview.com/u/yarr/
Donations:
LTC - LZUDfi91HEoL589gwBXRQ9WfrFnGYNnot5