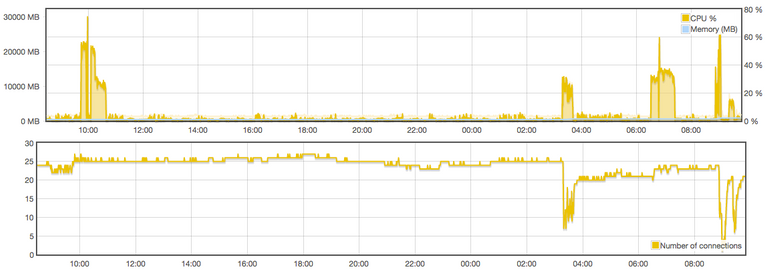
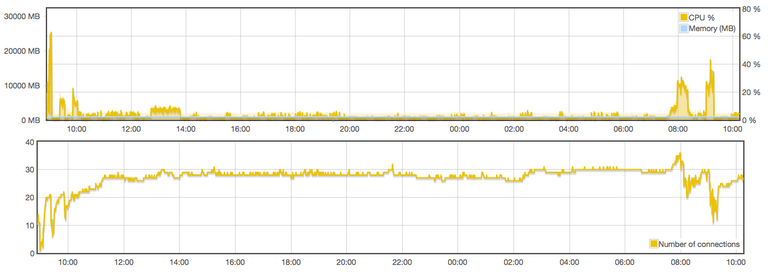
Here is a graph produced by bts_tools for the testnet while doing initial calibration and setup. This article will be updated as the day progresses and testing takes place.

Mostly the crew is getting setup to run actual stress test, so not much visible activity in terms of these graphs. We're trying to get the distribution of beacons (code that broadcasts transactions at a specific rate) scattered around the globe as well as API nodes, to simulate more "real world" conditions.
Haven't seen it discussed explicitly, but it would be great to test with both real world AND "theoretically possible" (i.e. setup a testnet with huge RAM on a high-core count, ultra-fast CPU, minimal latentcy, such as within a single datacenter) conditions. The focus of these tests are for real world conditions, which will be better for PR marketing.

Thank you for posting this bitshares information on graph @full-steem-ahead. Will keep on the look out for updates.
On the topic of bitshares......All sorted.....thank you.
Cheers!
Graphs are awesome.... so much nicer to view than just plain text chart data. :)
My guess is you are trying to see how many connections it can withstand vs cpu/memory requirements?
Thank you for your service as witness @intelliwitness.
Hey! I agree with you.... (maybe because we're the same guy?)
cpu/bandwidth (latency) - memory is still far from being a concern :D I was worried at first as well - re memory.