Wow! Very interesting! You are analyzing extraordinarily, sir.
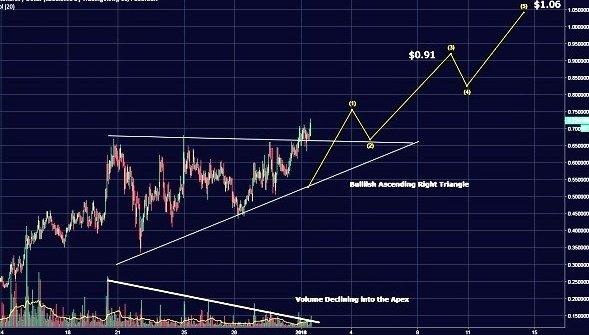
Please give a little comment about the chart below, sir.
This chart explicitly penetrates the top line and rises steadily. BTS It's so incredible.
The volume drops down as the price approaches the peak. This completes the Bullish Ascending Right Triangle pattern.
The reason for this decline is based on the overall decline of the seller. Because the price is approaching the peak.
Seen almost no sellers except buyers. Thank you, sir!
