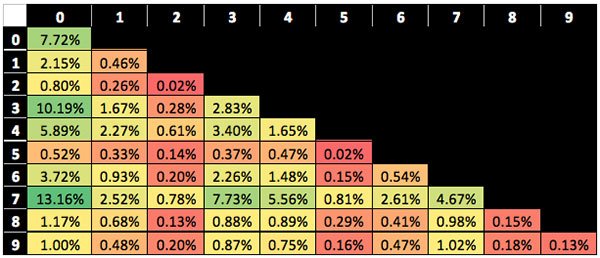
We’ve all been in one of those Super Bowl box pools. You know, the kind where you pay a certain amount and get assigned a square on a 10×10 grid. Each square corresponds to a pair of numbers, one for the NFC team and one for the AFC team. The score at the end of each quarter determines which square wins a portion of the total pot. For instance, if the Patriots lead the Eagles 17-14 at halftime, the person with 7 on the Patriots axis and 4 on the Eagles axis wins the cash.
Some pools also pay a smaller prize for the reverse box which would be Eagles 7 and Patriots 4 box.
I’ve always wondered which squares were most likely to win. Logic tells you that a combination of 0s, 3s and 7s could be good, while 2s and 5s are not so good. So what squares are the best and which numbers should you hope to randomly draw? I looked at data for all NFL games played since the 2006-07 season to determine the answer to that question. The chart above consists of all regular season and postseason games from 2006-07 through the 2016-17 playoffs. It represents the hit percentage for each pair (like-numbered squares are COMBINED in this table).
So what does this analysis tell us about this year’s big game? First of all, it tells me I wasted multiple hours proving to myself that 0, 3, 4 and 7 are good, and that if I get 2 or 5 I’m screwed. But based on the last four years of data, Super Bowl history and this year’s competing teams, I’ll go with quarter scores of Pats 7-3, Pats 10-6, Pats 17-13 and Pats 20-16.
Good Luck with all of your boxes this year!

Interesting post! I always wondered about that. Good to know that getting shitty numbers might not be so bad after all!