After a tough period for the BNB token during the bear market, issues with its founder CZ, the BNB has recover in 2024 and has been one of the few altcoins to reach another ATH.
Just a reminder that there was a lot of FUD about BNB during the bear market, stories continue to show up and there seems to be no end to it. Court cases were also involved against the CEO CZ that ended with his resignation, huge fine paid in the billions and prison time. But things seem to have been resolved for Binance now with a clear path forward.
BSC has gained traction in the previous bull market, especially from the users who were priced out from Ethereum due to the high fees. But now we have Solana around and BNB and Solana seem to be in strong competition for the Ethereum spot.
Let’s see how this chain is doing under the bear market conditions.
We will be looking at:
- Number of Addresses
- Active Addresses
- Daily Transactions
- Fees
- Contracts
- TVL
- Market Cap
Most of the data is collected from https://bscscan.com/.
Number of Addresses
One of the key metrics for crypto projects is the number of wallets.
First the overall number of wallets.
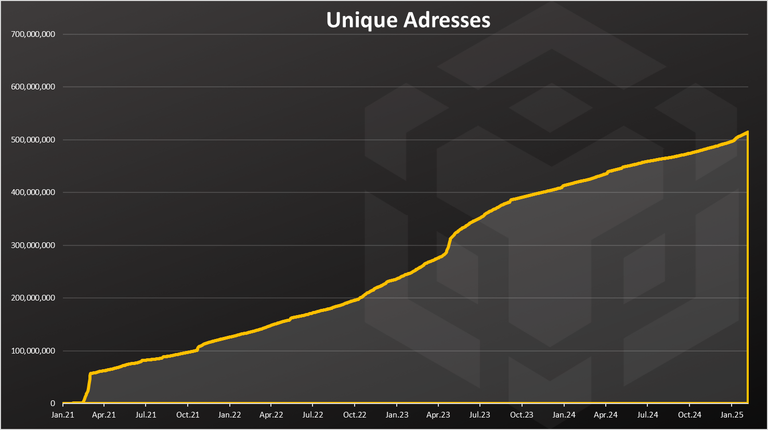
The number of wallets on BSC just keeps going up, no matter what.
The chain started growing back in February 2021, and since then it kept adding new wallets. What’s interesting is that there is a bump in new wallets created in May 2023 during the bear market. Since then, the numbers have steadily increased.
The BSC chain now has 514M wallets making it the number one chain in the world by the number wallets. For comparison Ethereum is now around 300M wallets.
On a daily basis the numbers of new accounts created looks like this:
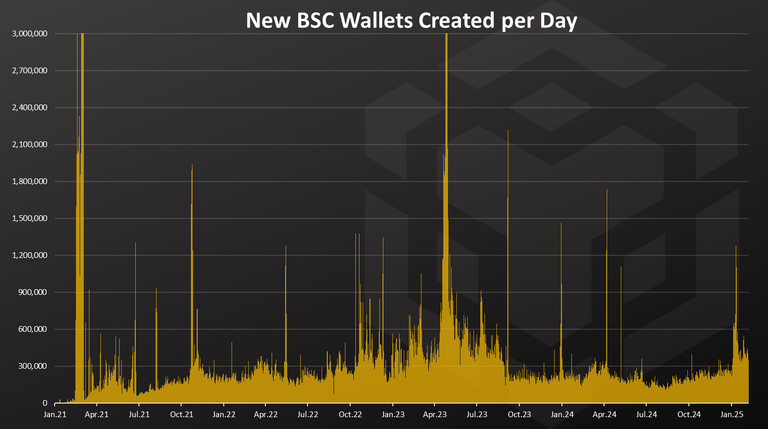
There has been a big spike at the beginning back in 2021, and a steady numbers of new wallets since then. It seems that the new daily wallets kept growing towards 2023 and then spiked in May 2023. Since then, there has been a small drop in the new daily wallets created and for a long period of time the numbers were around 200k.
In the last period this number has increased and there is now more than 300k new daily wallets created on the BSC chain.
Note that the creation of these wallets is free, so in some cases it can be seen as spam actions.
Active Addresses
What’s more interesting in times like this is how many wallets are transacting. How many of those addresses are actually active?
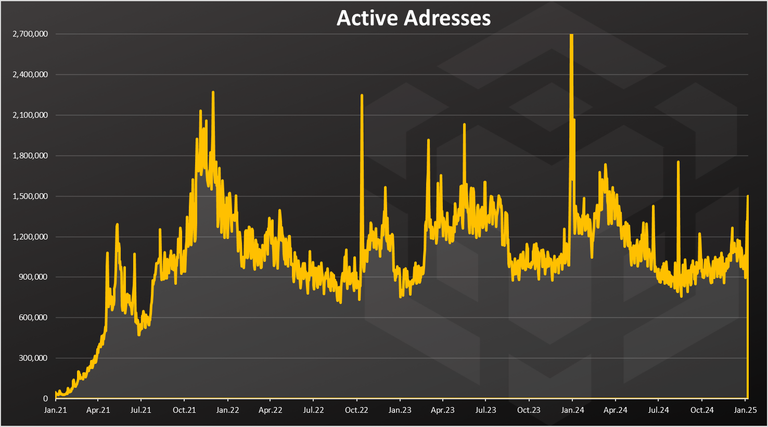
When we look at the number of transactions we have a better understanding of the situation. There was a massive growth back in 2021, then a drop towards 2022, and a sideways action since then up to recently. In the last period the number of transactions is around 1M daily active wallets.
Interestingly there is one big spike in January 2024, reaching more than 2M transactions in a day. Previously the ATH was in January 2022 with 2M active wallets. At the lows there was around 900k DAUs.
Compared to Ethereum for example, this number is around 500k these days.
Daily Transactions
The activity on the networks is mostly represented by the number of daily transactions. Here is the chart.
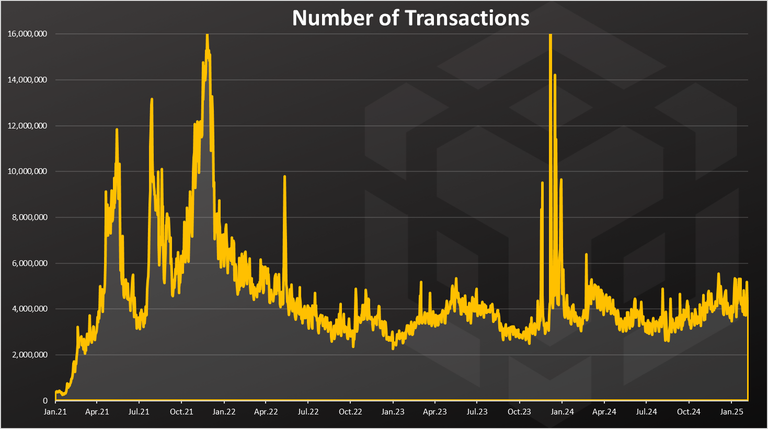
We can notice the spike in the number of transactions in January 2024. This corelate to the spike in the number of active wallets as well. Not sure what exactly happened in January 2024 that caused this. It was a short-lived spike with the number of daily transactions reaching 16M, similar to the previous ATH from January 2022.
During the bear market of 2023 the number of transactions was in the range of 3M to 4M per day. In the last period these numbers are around 5M per day.
Fees
Fees are quite the unpopular topic and one of the main reasons for the new EVM chains, as users are trying to find a way to escape ETH high fees.
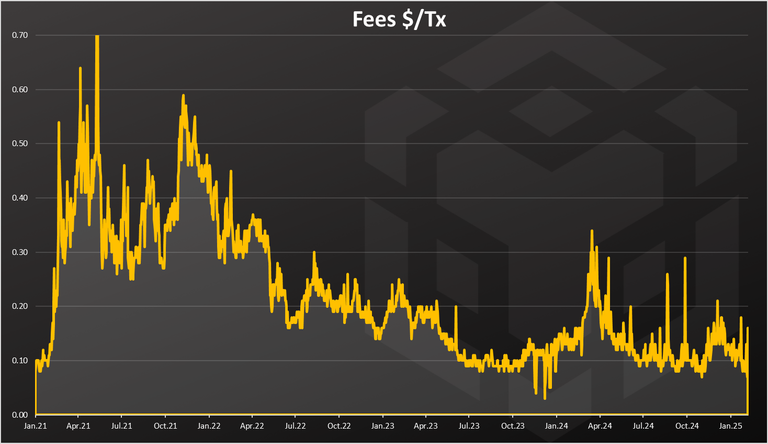
The fees are in dollar terms, average for the day.
After the massive growth in 2021 the fees have dropped during the bear, from 0.6$ to 0.1$. There was a spike in March and April of 2024 up to 0.3 and now we are back at 0.1$.
Contracts
BSC is a smart contract platform so here is the chart for verified contracts per day.
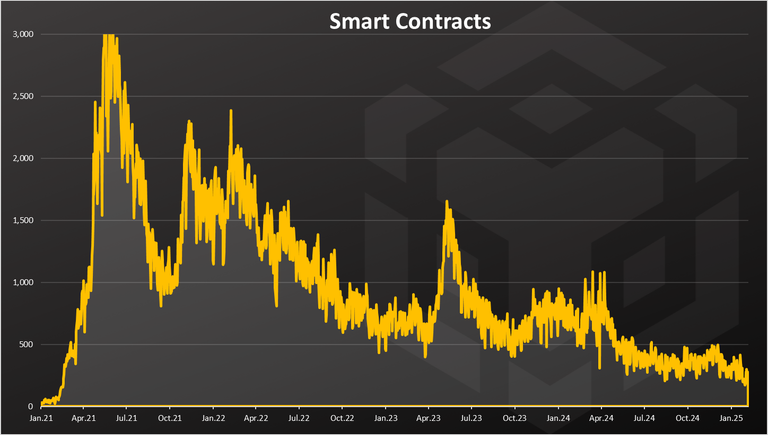
A massive growth in the first half of 2021, and downtrend in 2022. In 2023 we can see a spike back in May up to 1500 SC per day, but a drop since then to around 300 per day where it is now.
TVL
The total value locked is a metric that is often looked at these chains. It represents the capital that is put in the apps of the chain like DEXs, staking, lending etc. Here is the chart:
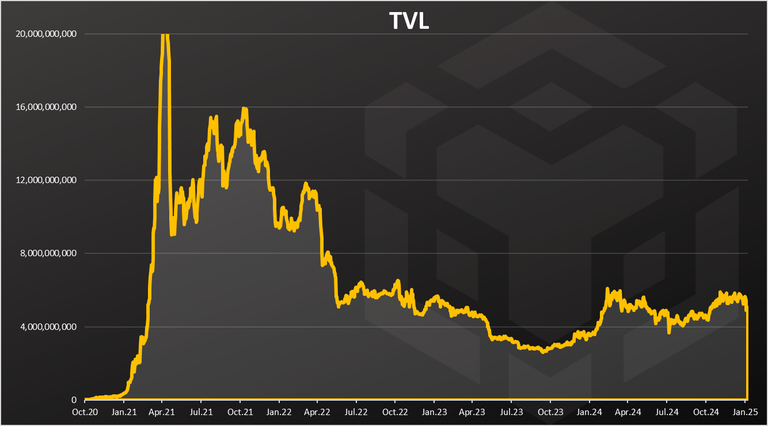
A literal explosion back in 2021, from zero up to 20B, then a consolidation around the 12B, a further drop to lows of 3B. In 2024 the TVL has increased up to 6B in March 2024, dropped a bit during the summer and back again in the last months. The market prices push the TVL a lot since the metric is in US dollars.
BNB Price
What about the market cap?
This is the ultimate metric for the chains. Here is the market cap for BNB.
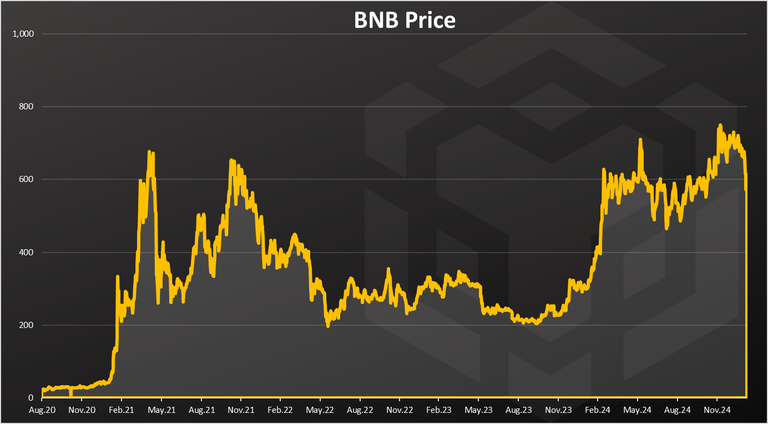
The BNB price had an amazing recovery and was one of the rare alts to reach the previous ATH in 2024. The price is now at 600 USD, back from the 700 USD where it was.
All the best
@dalz
The rewards earned on this comment will go directly to the people( @tsnaks ) sharing the post on Reddit as long as they are registered with @poshtoken. Sign up at https://hiveposh.com. Otherwise, rewards go to the author of the blog post.
BNB token price is increasing and fees are decreasing. It is a good and popular token.
Wow.. yea, BNB really looks good ! 💪😎👊
BnB is recently performing quite well