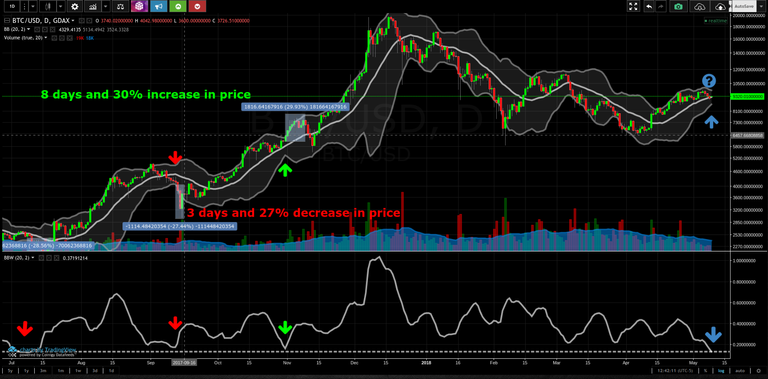
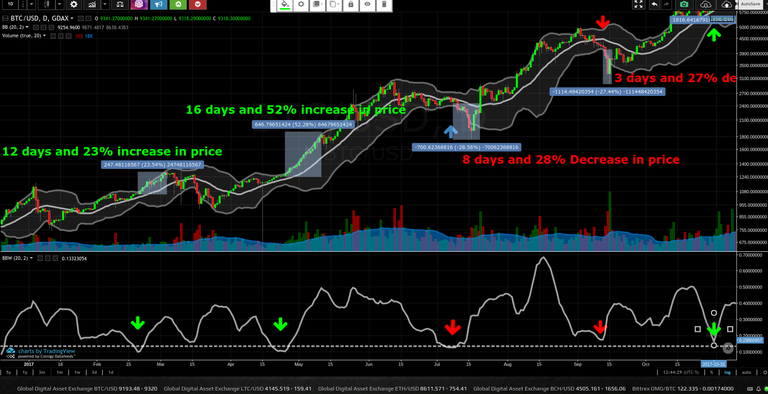
Love it or hate it, we are all fascinated by bitcoins volatility. If history is going to repeat itself bitcoin might be ready to get a little wild and crazy. Why so? Because of the current bollinger band width.
TradingView Wiki states, “Bollinger Band Width is a technical analysis indicator derived from the standard Bollinger Bands indicator. Bollinger Bands are a volatility indicator which creates a band of three lines which are plotted in relation to a security's price. The Middle Line is typically a 20 day simple moving average. The upper and lower bands are typically 2 standard deviations above and below the SMA (Middle Line). Bollinger Bands Width serve as a way to quantitatively measure the width between the upper and lower Bands. BBW can be used to identify trading signals in some instances.”
BB Width = (upper band - lower band)/ middle band. Now check out the charts and let us examine the past 5 times our bollinger bands pinched this tight. After the last pinch on October 31 2017, we grew 30% over the next 9 days. Before that September 12th. We dropped 27% over 4 days! The average days of the run followed by the pinch for the last 5 times is 9.3 days with a price change of 32%. Anyone have any extra salt and butter? We have got our popcorn ready! Like us if you are guessing we moon and leave a comment if you think we are headed downward.
Hi! I am a robot. I just upvoted you! I found similar content that readers might be interested in:
https://ctdn.com/algos/indicators/show/433
Congratulations @jhomes642! You received a personal award!
Click here to view your Board
Congratulations @jhomes642! You received a personal award!
You can view your badges on your Steem Board and compare to others on the Steem Ranking
Vote for @Steemitboard as a witness to get one more award and increased upvotes!