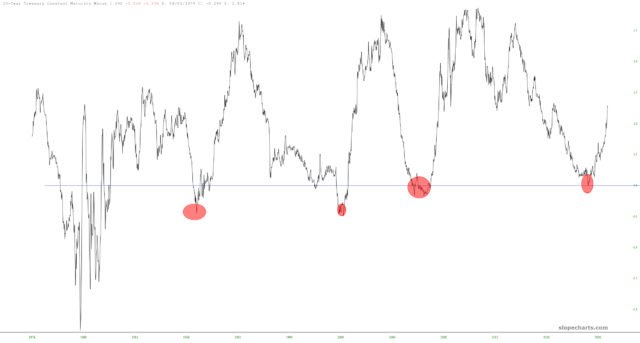
I find this fascinating: examine the symbol FR:T10
Y
2
Y, the 10-year rate minus the 2-year rate. This concoction has done a crackerjack job of predicting every single recession, and the most recent is no exception. I have tinted each instance when this data point went negative, and then reversed to highlight the “V” bounce in this spread.
10-Year Treasuries Long-Term Chart.  10-Year Treasuries Long-Term Chart.
The naïve observer might think, oh, peachy keen, the badness is behind us. Not at all. The badnessfollows. And it isn’t here yet. But it will be. I’ve circled with green where we arenow, andpriorinstances where we were roughly in the same place following the bounce. I have also put the years of those prior mean greenies, and every single year was an economic and market cataclysm.
 A Closer Look.