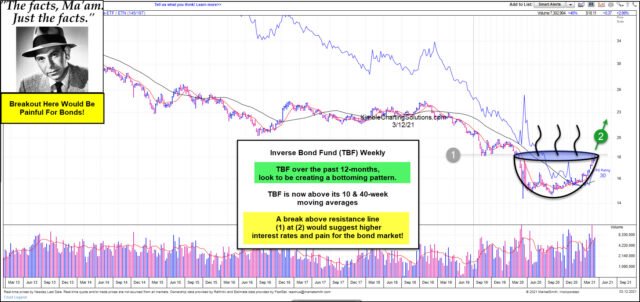
TBK Inverse Bond ETF Weekly Chart.  TBK Inverse Bond ETF Weekly Chart.
The bond market has had a bad 12 months as interest rates bottomed in March of 2020. Popular government bond ETF (i
Shares 20+ Year Treasury Bond ETF (NASDAQ:TLT)) has lost more than 15% in the past year!
Are bonds about to receive more bad news? They sure could.
This chart from Marketsmith looks at the inverse government bond ETF (Pro
Shares Short 20+ Year Treasury (NYSE:TBF)) on a weekly basis. It has been a poor choice to own for years and years, as falling interest rates have pushed is lower.
Its long-term trend could be changing, as it looks to be creating a bottoming pattern over the past 14 months and the recent rally in TBF now has it above its 10- and 40-week moving averages.
It is now testing its 2019 lows at the top of this cup pattern at the line (1), as relative strength continues to move higher off deeply oversold levels.
If TBF breaks out at (2), look for the bear market in bonds to accelerate.