Since shortly after the US November elections, my research team and I have been clear about our research and our belief that the bullish rally in the markets would continue to drive the strongest sectors higher and higher. In December 2020, we shared an article suggesting our proprietary Fibonacci Price Amplitude Arcs and GANN theory indicated a major price peak could set up in early April 2021.
On Feb. 3, 2021, we also published an early warning that Treasury yields were set up to prompt a big topping pattern sometime over the next 6+ months . We followed that up with a Feb. 21, 2021 article suggesting future gold and silver price trends may be tied to the moves in Treasury yields and the resulting stock market trends.
Now that the Treasury yields have completed what we suggested would be required to start a “revaluation event” in the stock market, we believe that a “Crazy Ivan” event may soon setup in the global markets. Many months back (August 28, 2019), we published an article about precious metals were about to pull a Crazy Ivan price event. (This prediction came true in 2020 and 2021.
Now, we are suggesting the global markets may pull a new type of Crazy Ivan event—a price revaluation event prompted by the rise in Treasury yields.
THE YIELDS SETUP
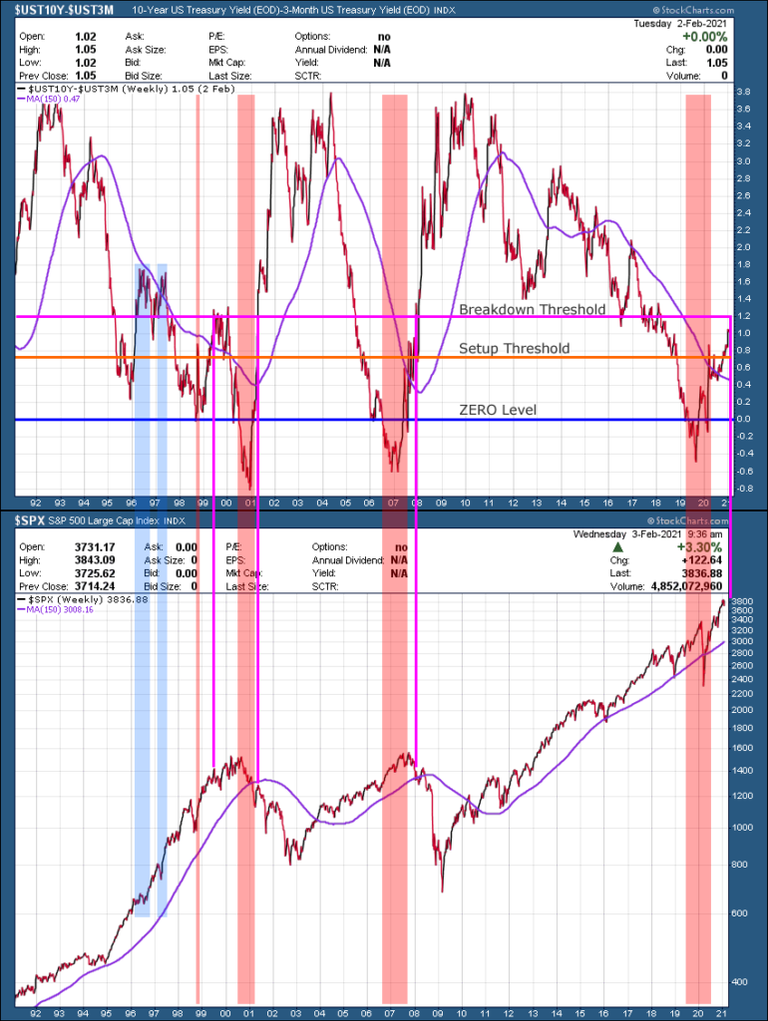
In our Feb. 3, 2021, research article about the Treasury yields, we suggested that a series of setup processes take place that prompt a broad market correction related to Treasury yields. First, yields must fall from levels above the Breakdown Threshold to levels below the Setup Threshold to complete the first stage of the setup. This first stage sets up the potential for moderate sideways price trends nearing a peak, or congestion.
The second stage of this setup is that yields must fall to levels below ZERO. This move creates the potential for one of two outcomes when yields begin to rally.
- If yields rally back above the Setup Threshold and/or the Breakdown Threshold, but then stall and reverse back below the Breakdown Threshold, then the markets will likely stall/congest or enter a sideways/rolling top type of trend for a period of 2 to 6+ months.
- If yields rally back above both the Setup Threshold and the Breakdown Threshold and continue to rally higher, then the markets begin to start a sideways/correction event which we are calling a Crazy Ivan event.
We have highlighted all the areas in the charts below where the yields have fallen to levels below ZERO and you can clearly see how the SPX reacted to these upside yields recovery events. Every time (in RED) where the yields rallied above the Setup and Breakdown Threshold levels, a broad market downtrend setup within 6 to 12+ months of this event. We believe the markets are about to do the same type of thing and we are calling it a Crazy Ivan event because we believe the current market setup is vastly different than the previous setups.
If the markets start to roll over and volatility continues to stay higher or rise, we can benefit from it with our Options Trading Signals in which we use non-direction trades to sell premiums. This allows options traders to profit from volatility and not worry about which way the market moves.
UST10
Y-UST3
M & SPX Chart  UST10
UST10
Y-UST3
M & SPX Chart
THE CURRENT CRAZY IVAN SETUP
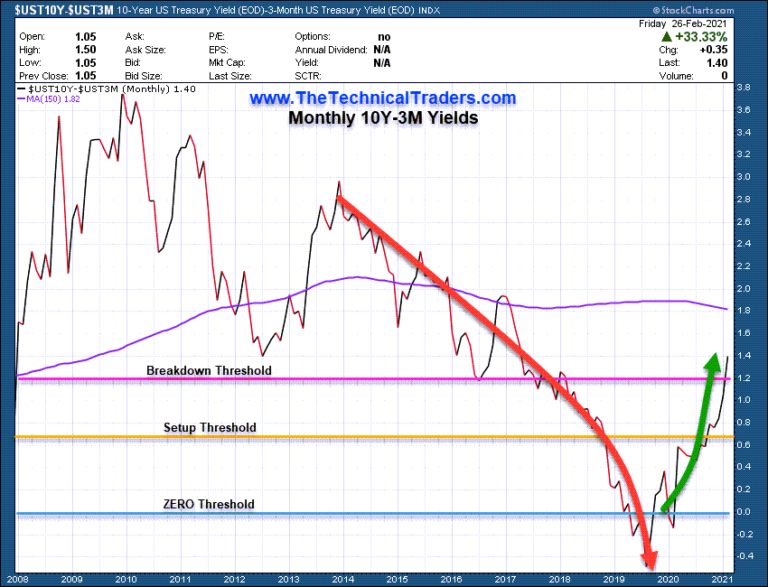
The following current yields chart shows a more detailed example of what is currently taking place related to the Crazy Ivan setup. Yields are back above the 1.35 level on this chart and have quickly rallied above the Setup and Breakdown Threshold levels.
If yields continue to rally from this level, we believe the markets will quickly shift into a sideways/rolling top formation which will eventually prompt a new Crazy Ivan price event (a big revaluation event). If yields stall near these current levels and move back below the Breakdown Threshold, then we may still see a bit of sideways trading for a while, but usually the markets will begin to resume an upward price trend if yields stay below the Breakdown Threshold.
The outcome hinges on what yields do in the next 4 to 12+ months and we believe traders and investors need to prepare for big shifting trends in major sectors and indexes going forward.
The setup process is already complete at this point. We are not waiting for anything to further complete this potential for the Crazy Ivan event. We are just watching yields to see if they continue higher or stall and move back below the Breakdown Threshold. At this point, the Crazy Ivan price revaluation event is almost a certainty—it is just a matter of time.
UST10
Y-UST3
M Yields Monthly Chart  UST10
UST10
Y-UST3
M Yields Monthly Chart
What we expect to see is not the same type of market trend that we have experienced over the past 8+ years—this is a completely different set of market dynamics. Don’t miss the opportunities in the broad market sectors in 2021, which will be an incredible year for traders of the BAN strategy. Staying ahead of sector trends is going to be key to success in volatile markets.
In the second part of this article we will publish later this week, we will review and share more data and details related to the rising yields and the pressures that will likely be placed on the global markets. You don’t want to miss the conclusions of our research.