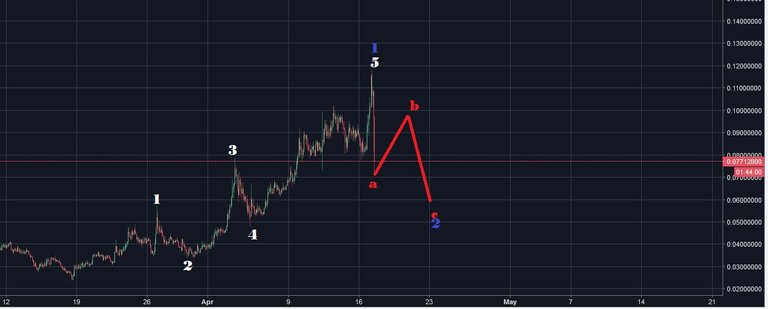
I cannot tell for sure which chart you posted, but is this is the $ chart, the bottom of white 4 overlaps with top of white 1. I have it a little different. Thoughts?
Your version is also possible. But if this correction goes any deeper (which it likely will in wave c) it hints at the completion of a wave 1 rather than 3.
Thanks, I appreciate the feedback. As someone who is new to this, it is particularly helpful to get some insight into the reason you lean one way over another, so thanks again.
Would you have any update for XVG, I m having trouble with the chart now and if its heading back up or this is part of a larger correction first from its recent high..with much gratitude.
Now forgive my ignorance I have only just started reading the frost/prechter book and so much to learn about EW! , the x2 & 2 2's etc have me slightly confused.
This chart is saying still on a downtrend and from here should drop to .065, then possible of .05 as lowest before another trend upwards?
I showed 3 different alternates in one chart. Sorry for the confusion. Every color is a different alternate in this chart. Correction is likely done. We are most likely in wave 2 correction.
Orange count needs another low but I think it is unlikely.
with this recent crash it seems like blue wave 1 is already done:

Awesome, you've been so much help!!! I sold all last 3rd near the top, now hoping to buy some back in bottom of C (or close to)
I hope I can go to sleep now for few hours and come back before it turns upwards again :)
I cannot tell for sure which chart you posted, but is this is the $ chart, the bottom of white 4 overlaps with top of white 1. I have it a little different. Thoughts?
Your version is also possible. But if this correction goes any deeper (which it likely will in wave c) it hints at the completion of a wave 1 rather than 3.
It doesnt matter much. Only time will tell.
Thanks, I appreciate the feedback. As someone who is new to this, it is particularly helpful to get some insight into the reason you lean one way over another, so thanks again.
Would you have any update for XVG, I m having trouble with the chart now and if its heading back up or this is part of a larger correction first from its recent high..with much gratitude.
Orange being the lowest probable.
Thank you.
Now forgive my ignorance I have only just started reading the frost/prechter book and so much to learn about EW! , the x2 & 2 2's etc have me slightly confused.
This chart is saying still on a downtrend and from here should drop to .065, then possible of .05 as lowest before another trend upwards?
Thank you again!
I showed 3 different alternates in one chart. Sorry for the confusion. Every color is a different alternate in this chart. Correction is likely done. We are most likely in wave 2 correction.
Orange count needs another low but I think it is unlikely.
Oh right, thank you.
That certainly makes much more sense, I am looking for a re-entry point, sold 2/3 at .11, then 1/3 at about 9.5 so did well.
Was hoping, like everyone it would correct more of course.
So end of the blue wave 2 and the start of wave 3 of a larger degree, potentially?