Nine days ago I gave my latest prediction on the market.
So how am I doing?
Is ice thinning at $58k?
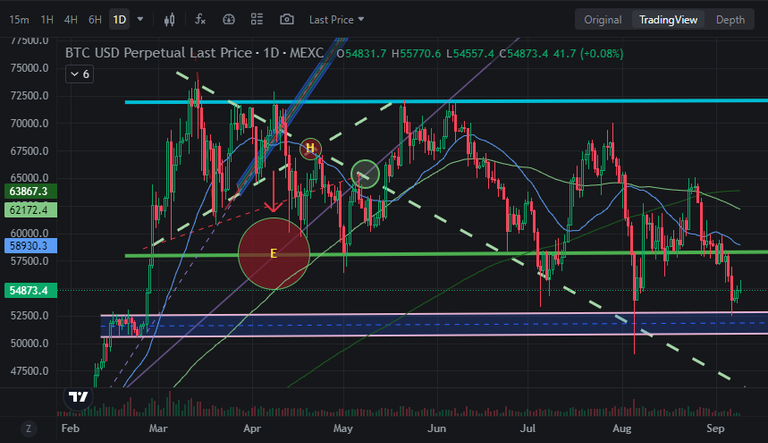
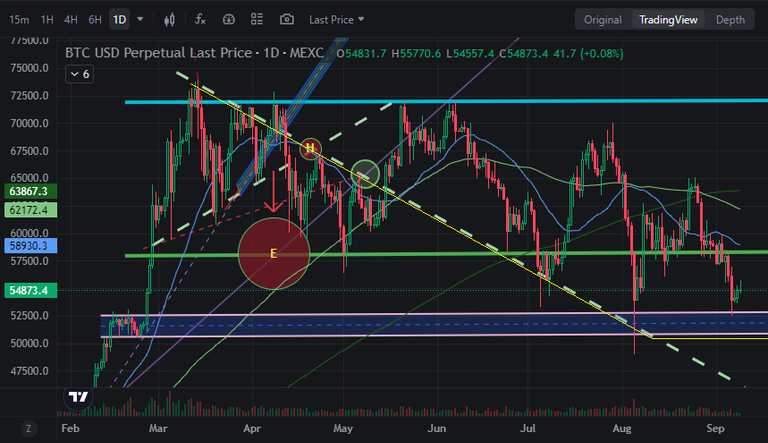
We're either in the process of building up pressure here at the key support line or we are about to crack back down to a frightening level. Considering we still have to get through at least half of September I'm somewhat assuming we'll slide downward somewhere between $53k-$56k.
Hm, pretty good
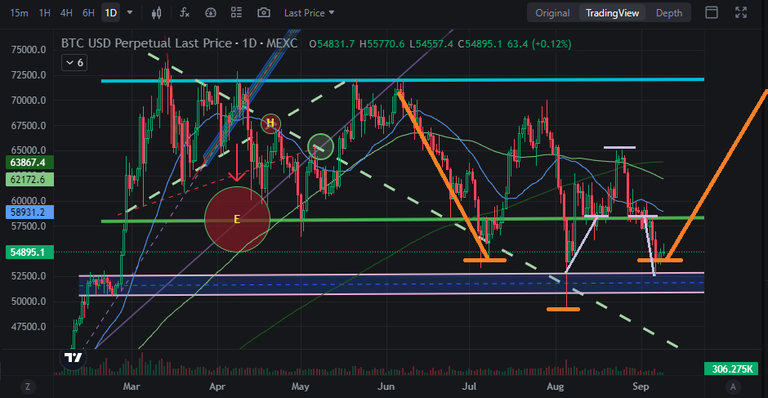
We bounced exactly off of that top pink line at $53k. The chart seems to have flipped from a bearish head-and-shoulders to a bullish inverted one. If the timeline on that played out we'd be back up at $68k+ by the end of the month. Unfortunately that may be a little optimistic considering the circumstances, but regardless of that I expect October and November to deliver us away from this horrendous crab market.
FED pivot on September 18th.
Unfortunately this is already very much 100% priced in and my guess is that number will go down when everyone collectively realizes that "buy the rumor; sell the news" is still very much a thing. A move like this would delay or completely break the inverted head-and-shoulders, so we'll just have to see how that goes.
Wow that is a busy chart!
You've gotta remember that I drew all these lines in March and April when I was day trading every possible opportunity that came my way on 1-hour candles, and I did very well. Apparently I did so well that the lines I drew are still totally viable even now. I was very much ready for this crab market. Unfortunately I didn't keep trading it because it was getting way too stressful. Now I sit in the background and watch from a distance like so many others (the traditionally correct move). Gambling profitably is quite hard, as anyone who's ever attempted it can attest.
Moving averages:
The dip we just got, marking the completion of the pink head-and-shoulders, has delayed the ability for us to get those much-needed golden-crosses. It looks like these golden crosses will come in October, which again is perfectly expected and textbook behavior for a Q3 transition into Q4 during a bull market. The consolidation is brutal but it's almost over.
Bullish scenario:
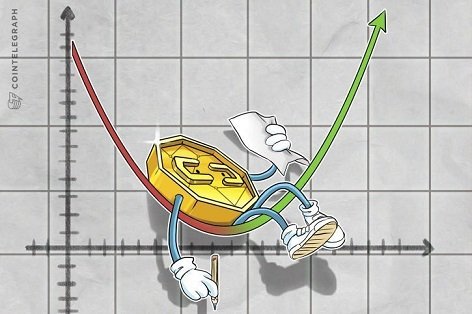
As is always the case, the bullish scenario is that we are currently at the bottom; on the verge of a pretty big rally up to $68k and beyond which will complete the orange inverted head-and-shoulders. I give this something like a 25% of happening because the timeline seems just a little bit too early with the whole FED pivot situation. Still, 25% is quite a significantly high percentage depending on perspective and positioning.
Bearish scenario:
There's a decent chance of fuckery here and the emergence of a completely new pattern. $58k could be resistance here and crabbing between there and $53k would suck pretty bad. The ultimate support zone is still the pink band between the $50k-$53k range. A rock-bottom grind in that range would be very stressful and shake a lot of weak hands out of the market. Many would assume this support would crack just like $58k, but it won't. We still have a lot of buyers of last resort like Blackrock and Fidelity who don't get shaken easy and essentially have infinite funds at their disposal. Don't forget that entities that actually want to buy more are begging for the price to go down with massive liquidity flows so they can fill their bags.
Many consolidations
Notice that the big dashed light-green resistance line that I drew in March flipped support in May and now finds itself almost completely out of play after being a rock-solid buy-the-dip indicator on three separate dips. I believe this support has been merged into the pink band support (highlighted with the yellow line), making the rock-bottom support even more unbreakable. At this point I think it's going to take an "act-of-god" to crack this level to any degree. Then again FED pivots tend to "magically" coincide with these "unseen events" like the housing crisis and and COVID scare and such.
A retest of this line at this juncture requires a flash crash to something like $45k. If Bitcoin gets to this level a revenge trade is highly appropriate, and I'll personally jump back into the day-trading game and throw in an aggressive long. It's good to plan these things out ahead of time because when they happen people are freaking out so bad that it feels like a bad move in the moment. Stick to the plan. Ignore the FUD. It's still a bull market (for BTC at least).
What about alts or the stock market?
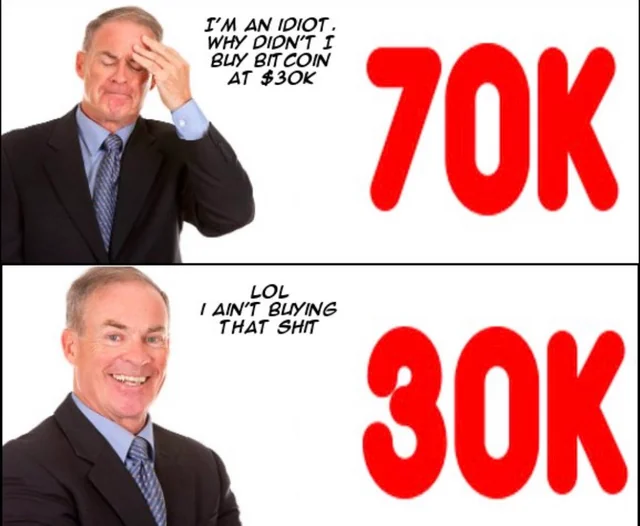
Highly irrelevant. I stopped trying to guess what alts or stocks would do a long time ago. Bitcoin is way more predictable than anything else, and yet we still manage to get suckered by the FOMO on very obvious 4-year cycles. Not this time. In my opinion it's always smarter to just stick to BTC and if you want higher risk/reward you just increase leverage rather than trading alts. Alts are more for moon-bags and conviction-holds than anything else. They shine bright but burn out fast right at the end of the cycle.
It's also quite entertaining to see people complain that stocks went up on a certain day but Bitcoin didn't. Or declare victory when stocks went down but BTC traded flat. The important thing is that it's still completely uncorrelated, which is always madly bullish on anything but short timelines. Zoom out.
Hive Inflation
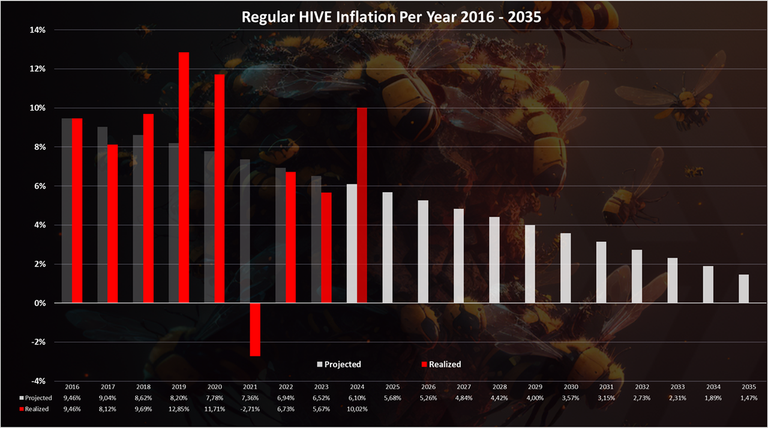
Scary red bar is scary! Then again it's also out of context. @dalz does a good job keeping track of this stuff and posting the raw data to be sure. The analysis of the data is something else entirely.
Hive inflation is high because the token price is low, and there are a great many reasons for why the token price is low, including this is just how the token cycles historically. There's a VERY high chance that we get negative-inflation (deflation) in 2025 just like we did in 2021. This data needs to be grouped into 4-year blocks. I'm not seeing anything here that is bothersome and reserve judgement until 2025 is behind us.
It turns out this time was not different. It's a 4-year cycle. A direct repeat here means that trading BTC into Hive at the end of the year will be another generational opportunity to accumulate the token. Best case scenario would be BTC pulling one of those crazy x4 end-of-year moves while Hive trades flat just like it did 4 years ago.
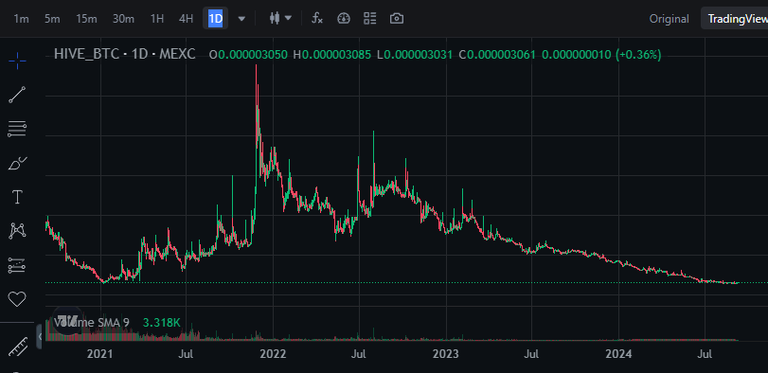
Of course if we actually look at the BTC/HIVE chart the time to start buying is actually right now as we grind on the bottom of last-cycle's support line. Could it go lower? Sure... but also this is the level I've been waiting for... for literal years. Stick to the plan. DCA. It's a bad time to get cold feet to be sure. Of course almost everyone who reads this is irresponsibly long on alts so this is a difficult pill to swallow knowing that we call collectively fumbled the bag once again. Luckily our actions in 2025 will be the determining factor just like ever other 4-year increment.
Conclusion
Is September over yet? Woof!
Three more weeks to go including a sell-the-news FED pivot.
Should be fun.
Can you see the light at the end of the tunnel, anon?
Maybe there is light, however we need to remain level headed and take the community forward...
BTC/HIVE keeps bending low and low
Well, no panics!