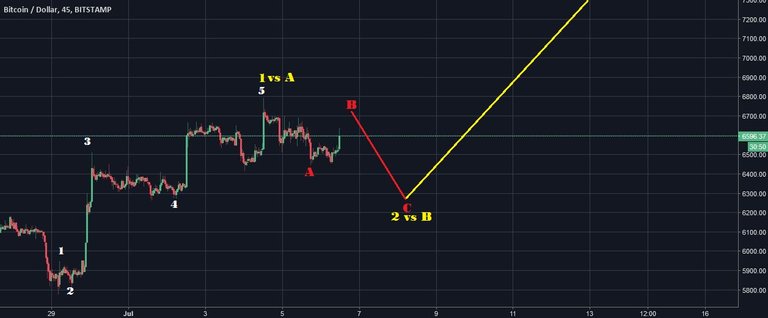
Weird. I am not sure if I am missing something here or not, but I can't make an impulse (5 waves down) out of this current move down. It has to be a WXY for red wave A.
What this implies is, that we are in an impulse wave up (yellow wave 1 or yellow wave A). From the current view of this chart I cannot derive any new low below 5770 in the short-term. I think we are going up now for at least a big ABC pattern (target zone 7300-8000$).
This is good news... stay tuned...
.png)
If you think this to be useful information:

.png)
.png)
MUST READ!
DISCLAIMER: This post / analysis serves general information purposes only. I am not a financial adviser. The material in this post does not constitute any trading advice of any kind. This is just the way I see the charts and what my trading ideas are. I use chart pattern and Elliott Wave analysis for my trading ideas.
For full disclosure: The author of this post is holding positions in this market at the time of this post. Please conduct your own due diligence, if you plan to copy anyones investment decisions!
If you make any trades or investments after reading this post, it is entirely at your own risk. I am not responsible for any of your losses. By reading this post you acknowledge and agree that you will never hold me liable for any of your losses.
Feel free to use and share my charts, but please mention me, @ew-and-patterns as the author. Otherwise it is considered plagiarism and I will flag you and advise my friends to do the same.
Please consider leaving a comment, like or resteem, if this post entertained you or helped you see things differently...
Have a nice day :-)
.png)
.png) #crypto #cryptocurrency #steem #sbd #bitcoin #btc #bch #eos #ethereum #eth #litecoin #ltc #ripple #xrp #stellar #xlm #nano #cardano #ada #vechain #digibyte #dgb #binance #tron #trx #iota #neo #xmr #dash #omg #verge #xvg #bitshares #bts #finance #money #investing
#crypto #cryptocurrency #steem #sbd #bitcoin #btc #bch #eos #ethereum #eth #litecoin #ltc #ripple #xrp #stellar #xlm #nano #cardano #ada #vechain #digibyte #dgb #binance #tron #trx #iota #neo #xmr #dash #omg #verge #xvg #bitshares #bts #finance #money #investing

I am long and the daily looks to have turned in my views/chart
I see the downtrend started in december clearly broken thru on the non log chart.
As a result i am long atm, slightly scared and ready to stop loss in case we are moving down again.
What i fibd troublesome is that there does not seem to be much punch in this move (volume) which makes me feel we may still be in the apex and not done with consolidatio
Right, if we don't see a lot more volume in wave 3, it is probably only a wave C before the next drop.
Waiting for second low then..
how can these charges predict the mentality of humans?
Because Price effect due to selling and buying, It's total human phenomena, then why these waves?
Maybe "3 steps forward 2 steps back" is a universal law of our universe? Maybe it is just fear and greed of people? But it doesn't really matter what it is. What matters is that the same patterns can be observed in any liquid asset over and over again. So if we know the pattern, why not use it to our advantage?
Where do you see the yellow roughly heading to at this stage?
7300 -8000.
Are you sure this time bitcoin going uptrend
Next important level is $6,800. A breakout of that level would push the price higher and we may see Bitcoin at $8,000.
I have written a detailed article about that just this morning.
Anyway, let's see if the ABC pattern will give results ;)
Good luck!
Indeed strange pattern. Initially I thought it was forming an upward point wedge but this is now unlikely
On Bittrex, BTC/USDT market did not put in a new low on 28/6.
I wonder whether you think this could be possible on that market: currently working on wave circles 4 of i, where circled 1 began on 24/6. Based on this, projecting circled 5 of i to complete around $7034.

I considered this too and it is possible, but a truncated wave C is kinda rare and it just does not look right to me.
Your red wave b also hit the 1.618 extension of 1 to the tick, so it is likly the high of your wave 3. But other than that, consider this my new primary count if my wave C does not show up before 6800 is breached.
Thanks, I appreciate the detailed response, it helps with my learning!