Hello fellow steemian traders and all people of peace,,

Please do not take this as financial advise -- the crypto space is very unpredictable and things can change fast.
But I really find this quite interesting.
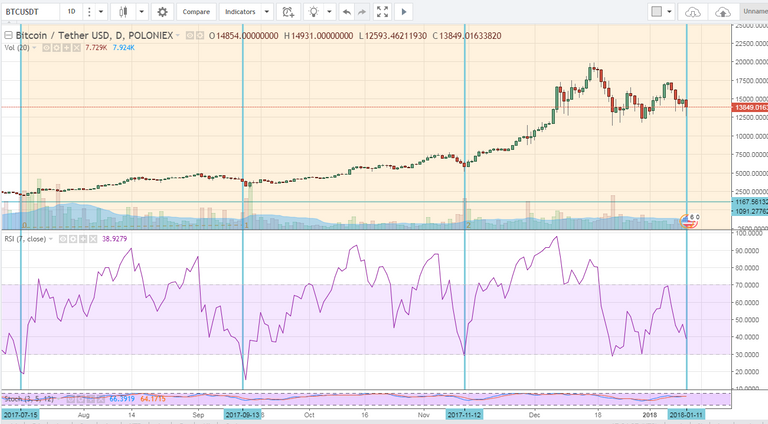
By installing the Fibb time zone tool on the lowest dips 'oversold' with RSI (7) indicator, on the day timeframe charts -starting July 15 2017, it indicates that between Jan 12-14, 2018 the BTC/USD pull-back will most likely be over, ready for the next all-time high.
I personally don't have a trading plan using this ,, I just enjoy watching what happens.

Let me know what y'all think!
Im open to do technical analyses, send me your ideas that you may have.
please ask question, get involved
Love you all
Peace
it might bottom @ 10750+/-

Agreed. Now is an amazing time to buy!
Thank you so much for the up-vote,,, well it seems that this analysis was a off a bit,, support has been broken and at this point ,, who knows what come next,, Cheers!
Congratulations @frankyboy34! You received a personal award!
You can view your badges on your Steem Board and compare to others on the Steem Ranking
Do not miss the last post from @steemitboard:
Vote for @Steemitboard as a witness to get one more award and increased upvotes!