
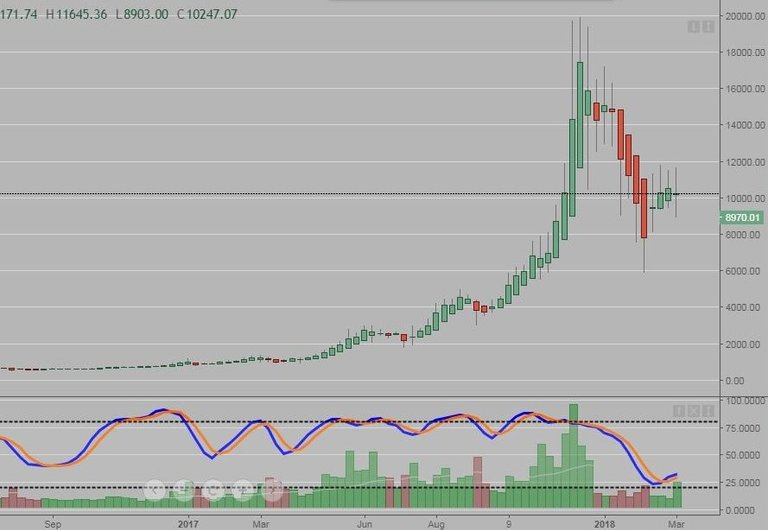
The weekly BTC chart from the GDAX exchange still has green heikin ashi bars, but that may not last long should the price continue to decline.
The current candle is a doji which is often seen as a reversal point. (But this week is not over yet)
Current Stochastics is bullish with the K line crossover of the D line last week.
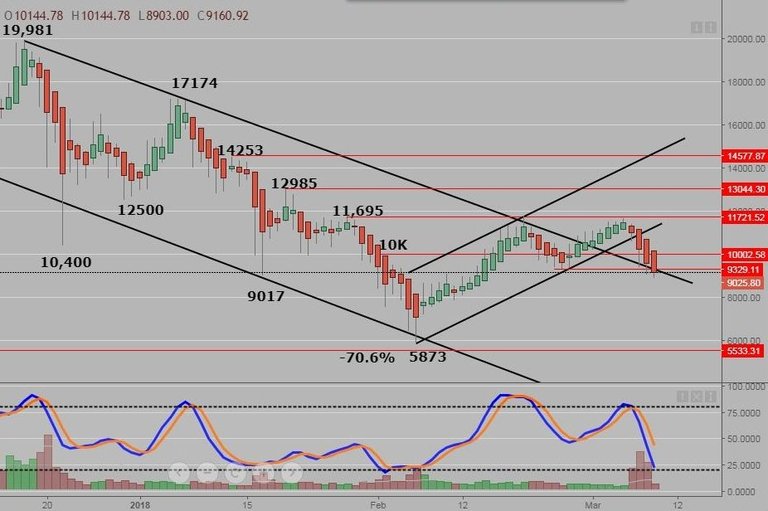
On the daily chart, price pierced through the upper trend line and has reversed after reaching the 11.6k level for the 2nd time. The same trend line may be a support level?
4 red heikin ashi bars confirm the downtrend
Stochastics is heading down quickly and close to the oversold 20 area
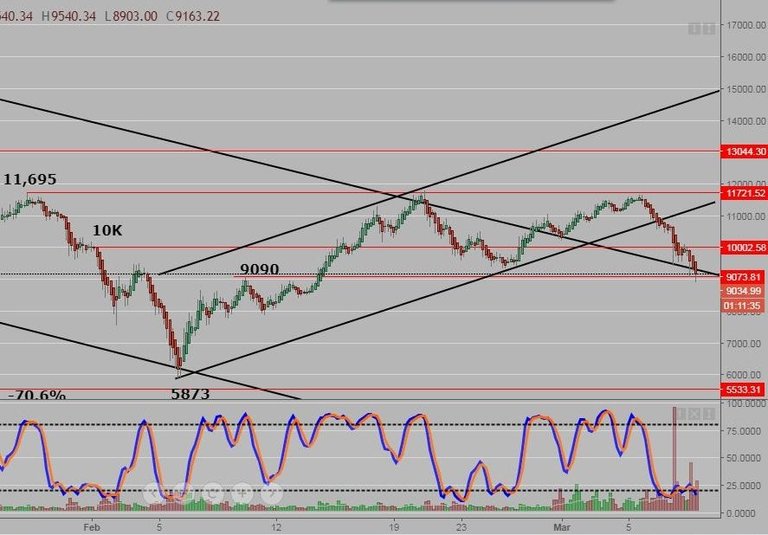
The 4 hour charts show more detail and a large sell spike. If BTC breaks the 9090 level, there is not much support left to the last bottom on Feb 6th.
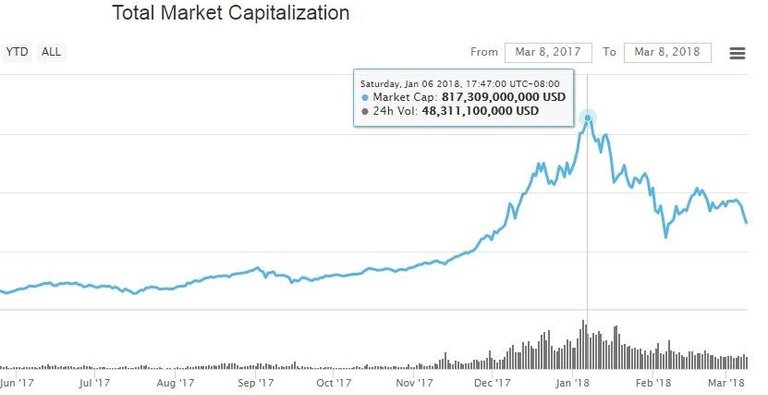
The high for the crytpo marketcap was 832 billion in December 17, it is currently 364 billion and dropping.
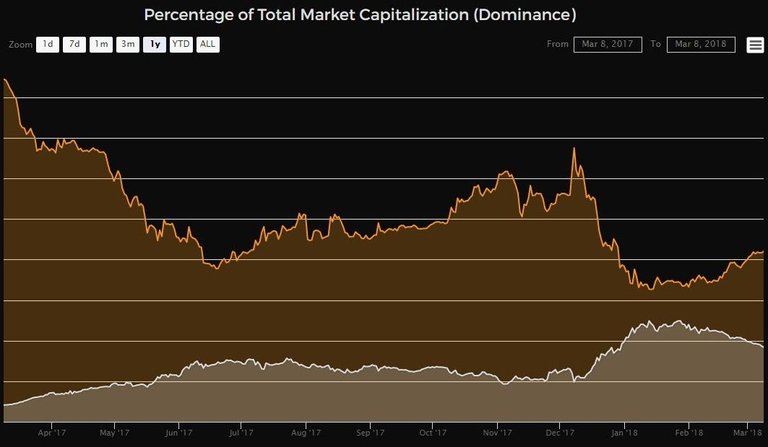
Market cap dominance of BTC (orange) vs the Alt coins (silver). Alt's on a slight decline and BTC on the uptrend.
At noon today, I read that there may have been a possible hack into the Binance exchange which was causing the BTC selloff. I'm not 100% sure that this was the cause as there is always a LOT of news on a daily basis regarding BTC.

Some of the latest headlines/FUD.


I still speculate that the February 6th spike low was the low for 2018, but we will not know for a few weeks and maybe months? I'd like to hear your opinions in the comments below.

Need a crypto hardware wallet? Affiliate link to the Ledger Nano S
https://www.ledgerwallet.com/r/ed7f
Good Job Fri...
Nice analysis. We have buyer orders at $8400

However, wait for price to bottom as indicated by the yellow circle. Next wait for price to make higher lows as indicated by the green circles. This is what I call a confirmation entry, waiting for price to show you that it wants to reverse.
I would be a bit surprised if it took out the Feb 6th low, not impossible though.
Yeah I would be surprised if it goes as low as that as there is a lot of support at that level...
Great info!! Yeah I'm thinking we might hit 8k then bounce off that, then we will see what happens.
This market is so hard to predict and analyze
The downward and the upward graph trend is the characteristics of every market... So it will change.. Thanks for the info bro..
Yeah, a bear market within a long term bull trend.
You are correct sir,these bears are every where now.btc may dip around 7200.lets see what will happen.
You got a 3.60% upvote from @postpromoter courtesy of @glennolua!
Want to promote your posts too? Check out the Steem Bot Tracker websitevote for @yabapmatt for witness! for more info. If you would like to support the development of @postpromoter and the bot tracker please
This post has received gratitude of 5.27% from @appreciator courtesy of @glennolua!