Hello everyone!
This is my first Technical Analysis on Steemit and will be concern BTC price (long term).

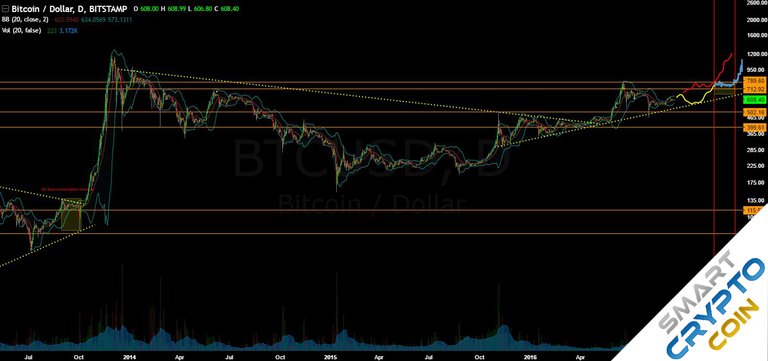
1 Day Bitstamp chart - 2016/09/19

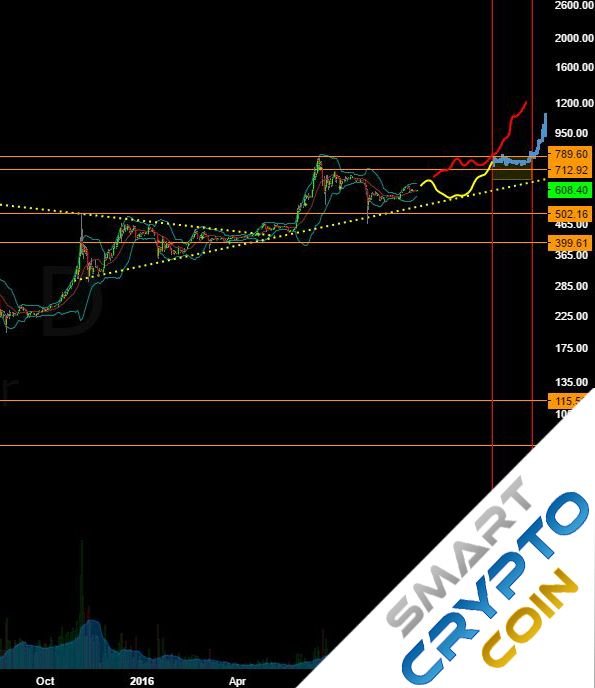
Zoom
Currently, Bitcoin is consolidating in the yellow outlined ascending triangle between $650 and $550 but pending a retest of previous support turning resistance at $650. Once $650 we have two potential scenarios that can happen:
First scenario - Seen in YELLOW line on chart: After hitting $650 Bitcoin will drop back to $650-660 area to double bottom and increase to $790.
Second scenario - Seen in RED line on chart: Once $650 gets hit, Bitcoin will continue past that resistance after consolidating further and retest $790.
In any of the two scenarios the outcome is still a retest of $790 in the end.
From there we will be able to continue our journey way higher.
If we manage to hit $1000 Bitcoin could get higher due to increased media coverage and more interest / hype that will bring new money in to the market.
Have a good day & trading!
DISCLAIMER
I am showing multiple scenarios on the price movement, in the post itself I do not take any stance, either bullish or bearish. I am not responsible for neither you’re winning nor you're losses upon trading!
This is my personal opinion and doesn't mean I have to or do hold any positions in the given market.
Igor from SmartCryptoCoin
Congratulations @igorsanko! You have received a personal award!
Click on the badge to view your own Board of Honor on SteemitBoard.
For more information about this award, click here
Congratulations @igorsanko! You have received a personal award!
Click on the badge to view your Board of Honor.
Congratulations @igorsanko! You received a personal award!
You can view your badges on your Steem Board and compare to others on the Steem Ranking
Vote for @Steemitboard as a witness to get one more award and increased upvotes!