Hi~ Traders.
Only downwards trading view-point description.
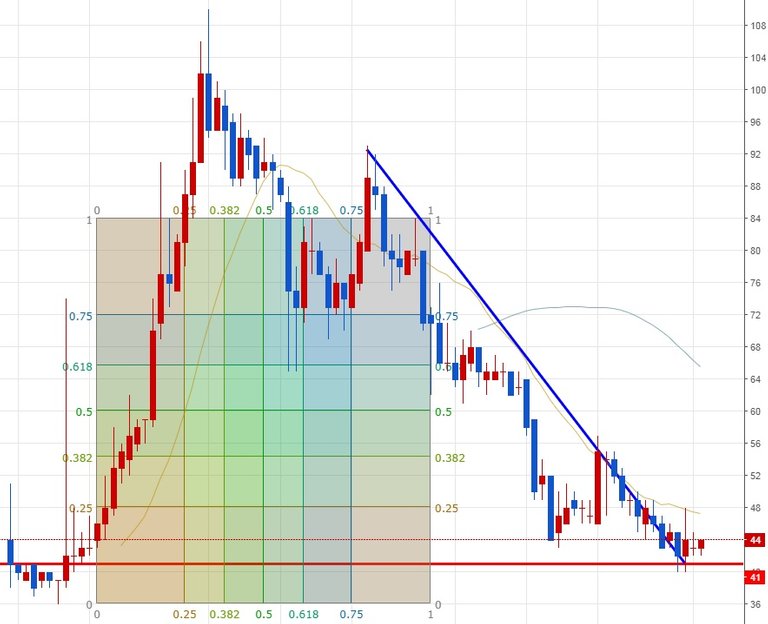
- Bitcoin (BTC) , 1-hour candle chart
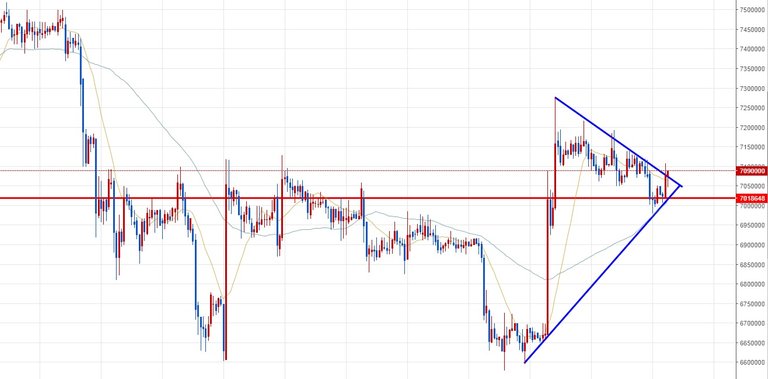
The trend is to transition, and staying in the resistance of the red line.
It is the inflection point of triangular convergence. It expect to rise.
- Ethereum (ETH) , 1-hour candle chart
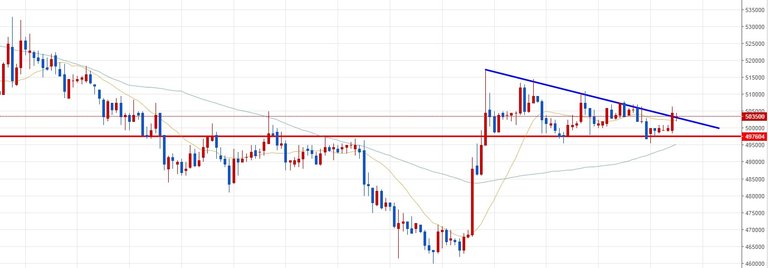
Ethereum is similar a bitcoin.
- EOS , 1-hour candle chart
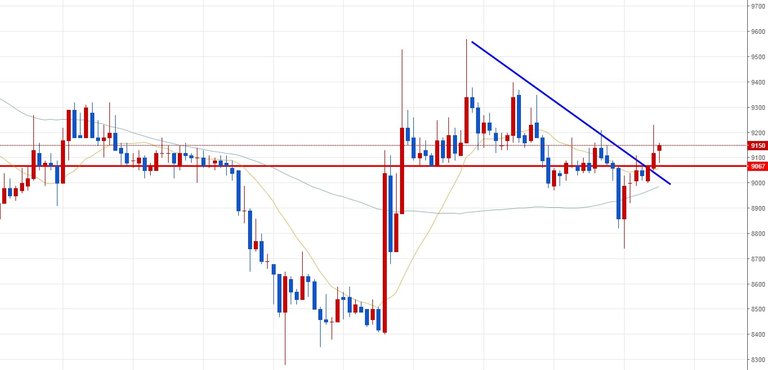
EOS is similar a bitcoin.
- Ripple (XRP) , 1-hour candle chart
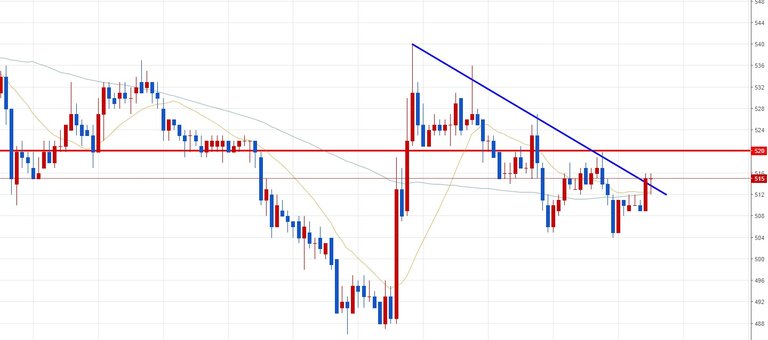
XRP is similar a bitcoin. However, It came down a little more from resistance line.
- TRON (TRX) , 1-day candle chart
The bottom is the lowest. Trends are expected to transition.
It is better to look at the swing trading view-point.
** Disclaimer: This post is a personal idea, not an investment idea. The transaction is a small transaction, so please enjoy it. It is your responsibility to invest, and you should be aware of subjective judgments and technical analysis to make investments.
Coins mentioned in post: