BTC Update! Equilibrium patterns education!
(This post is from a previous post I make in another crypto group so just copying here as I start to get more involved on SteemIt!!)
Many of you know already, my favorite pattern is equilibrium chart patterns. Just such low risk entries for quick and immediate profits. But today I had a few questions on how they work or what they are. So not so quick info on them.
Equilibrium patterns are just following the price movement trends. All markets move up and down but recognizing where they are moving up or down to is key. Are they going up, then down and then up higher? Or up then down and then up lower? etc.
Equilibrium patterns are simple. Its an established level such as a high or a dump to a low. You then see a series of LOWER highs and HIGHER lows. It's tightening the pattern up, AKA less price movement between levels as we get tighter and tighter.
ok, so what does that all mean trade wise?
These are 50/50 patterns in my book. You DO NOT enter bullish (or bearish if shorting) until the higher low or lower high is lost. Period.
I've posted tons of these charts over the months for the equilibrium patterns I play. Today being the most recent, 3 days ago the time before that. I am posting both of those charts again here.
Key things you watch is price trend. Is it moving up or down? Eventually it reverses direction and then reverses again, etc. BUT when those reversals are occurring in a tightening pattern, all alerts should go off. PAY ATTENTION to this pattern!
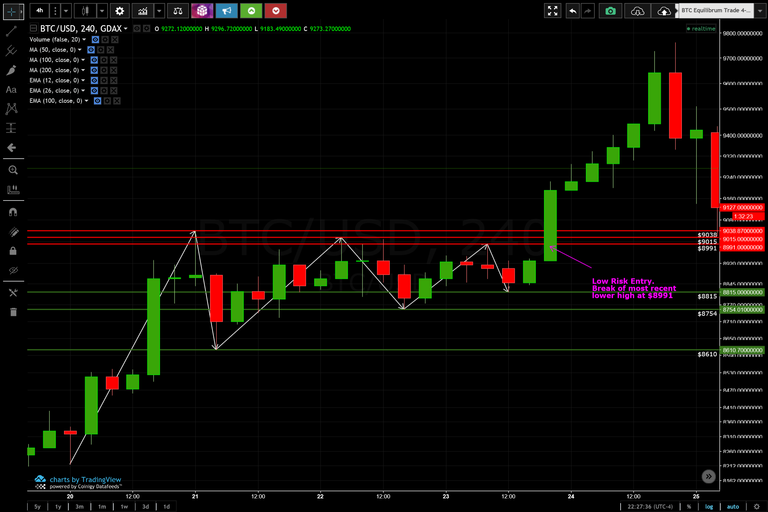
First one - 3 days ago. 4 hour chart. We were running up. We set our initial high at $9038. We then pulled back to $8610. This became our low. At the time we don't know this will shape into an equilibrium pattern. NEXT we run back up and hit a high of $9015. (FIRST indication of possible equilibrium pattern taking shape.) This becomes our LOWER high. We reverse and drop to $8754. This becomes our HIGHER low. (CONFIRMED we are entering equilibrium pattern). Up again to $8991 for another lower high, down again to $8815 for another higher low. THEN comes a change in pattern where BTC breaks the pattern and instead of forming another lower high (lower than $8991, it moves above it. This is my automatic entry. Zero questions, zero cares given on anything else. Pattern has shifted from lower highs to bulls going above the level. What ensued? A straight bullish move from that entry at $8991 up to $9,763 in a day.
Todays trade. I posted the original chart early this morning (US East coast) that another 4 hour equilibrium pattern was in play. This occurs off the original high we just set from prior chart of $9763. From there we dumped and dumped hard and this is where I played yesterdays oversold bounce trade (see yesterdays charts as oversold bounces are an entirely different discussion).
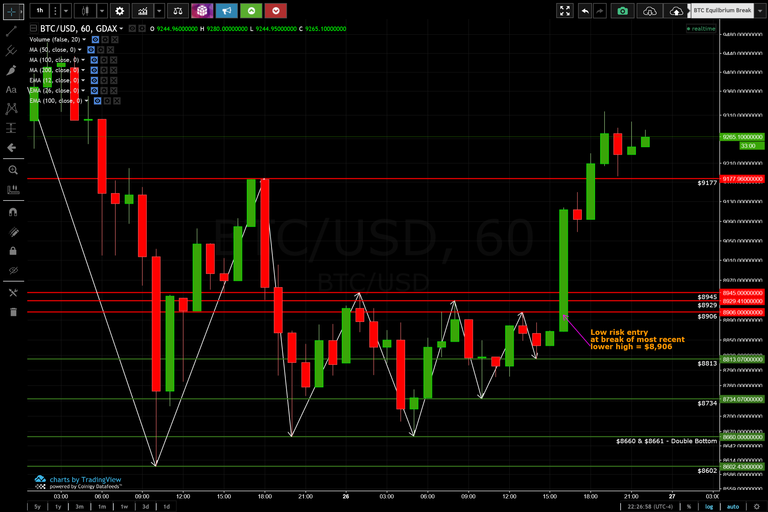
So we bottomed to $8602. This is our bottom. We then ran to $9177. This becomes our high. Again, we don't know this is an equilibrium pattern yet. Then comes our first HIGHER low at $8660. (First sign of equilibrium pattern shaping). Reverse back up to $8945 and this becomes our first LOWER high. (Confirmed we are in an equilibrium pattern). Back down to $8661 to form a HIGHER low by $1! Yes there are reasons these patterns come within cents or single dollars of holding. Traders are on watch for them. Reverse up to $8929 for our next lower high and back down to $8734 for another higher low (this shows poorly on 4 hour chart, better on 2 or 1 hour since the same high and low occurred within 4 hour time frame). Reverse back up to $8906 for yet another lower high and then back down to $8813 for another higher low. I am showing this chart on 1 hour for clarity reasons as if you weren't physically watching the movement, 4 hour chart does get a bit jumbled. Now we reverse from $8813 and the expectation is another lower high (lower than $8906) but the bulls push above it. Again. This is no questions asked entry for myself as it is a change in the pattern we have been watching literally all day (lower highs and higher lows). Enter at $8906 and bulls carry it up to $9318 within 3-4 hours.
These are extremely low risk trade entries for solid profitable rewards. And they occur daily across coins, often several times per week across any specific coin. They can also occur at any time frame but the larger the time frame, the bigger the potential reward. A 5 or 15 minute equilibrium pattern holds very little water compared to a 4 hour or daily equilibrium pattern.
And for this reason, it's exactly why TA continues to work and continues to rake in profits for traders. Yes there are great probabilities on candlesticks or other chart patterns for how often they play out bullish or bearish and those are all fantastic things to know/understand. But the reason I love my equilibrium patterns is because each time the pattern tightens up with a lower high or higher low, it gives me an exact entry point for a bull move if that level is broken or an exact exit point for a bear move if that level is broken (and I am already in a position from something prior) or if the bear break happens and someone wants to short, it gives the ideal short entry position.
I know this was way longer than anticipated but these play out over and over and over again so this will now become an easy reference for each time someone messages me and asks what is an equilibrium pattern.
Again, trade at your own risk, learn and understand proper entries/exits, risk/reward relationships and a bull or bear market can bring you loads of profits.
Just My 2 Sats!
.png)
.png)
Hi! I am a robot. I just upvoted you! I found similar content that readers might be interested in:
https://www.facebook.com/groups/CryptoCurrencyCollectorsClubPublicForum/permalink/209098866374824/