When Helical Insight first announced a couple of years ago that they were releasing an Open Source Business Intelligence (BI) tool, it really caught my interest and I reached out to founder Nikhilesh Tiwari to find out more about what he was doing. I spent a little time with the product and really liked where it was going and was determined to do more of a deep dive in the future, and with their release of version 3.0, that time is now.
Helical Insight (HI) is a Java application, so the installation was pretty straight forward, download the JAR file, double click and run the installer and take the default settings. It’s worth noting that you can use the application either on-premise or in a hosted cloud environment, I didn’t check if you can use it on AWS, but I imagine you could.
Now we’re installed and we have a login page with extensive support for Single Sign On (SSO) as part of the role management. Since HI is a browser-based application, the developers planned ahead to make sure that it can be white labeled and embedded into your own systems. This embedding extends to the designer and report creation interfaces as well, not just the report delivery.
What I really liked out of the box was the variety of data sources and flat file options that were available to connect to, however, I didn’t see a method to connect to an API. In order to connect with certain data sources like ElasticSearch, have to jump through some hoops and using something like Dremio which is some additional work and would have been nice to have available by default. That said, HI does provide tight integration with the JDBC4 driver which gets you connected directly to pretty much any database.
Once the data source connections are defined, then you need to create the metadata that describes all the joining conditions and relationships for the data, the metadata also allows you to embed SQL queries, a powerful feature. The metadata definitions allow for granular level security definitions, down to the table level/column level and actual data/row-level for user roles profiles and organizations. The security layer also allows you to write Groovy security code to create very complex security conditions as well. One lack I saw with the metadata definitions is the lack of ability to create any cube or hierarchies or be able to define data types, this would be a desirable feature and make reporting easier in a variety of places.
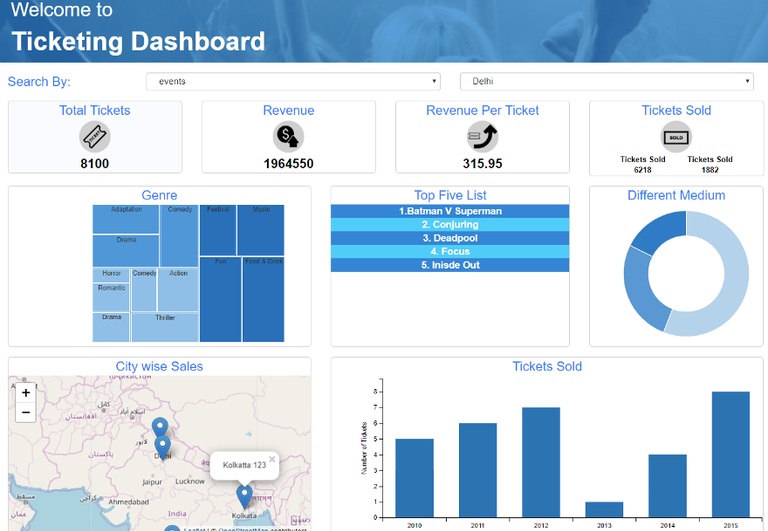
Reports are generated from the created metadata, the ad-hoc reporting interface supports a wide variety of different charts which will fulfill most needs, such as table, pivot, maps, grouped charts, card, axis charts, pie, donut, sunburst, even treemaps. Certain charts will only work when a certain number of dimensions and measures are available on the canvas and if those conditions are not met those charts appear blank. The ability to disable a blank shart would be a good feature.

While the charts have a significant number of customization scripts available and the “custom” column allows you to put your own SQL/match calculations right there, a UI interface for putting specific types of calculations would have been helpful for your typical business user. That said, HI has a really cool feature to allow you to add any kind of Javascript based chart you want to within the applications. The charts have placeholders to add CSS, HTML and Javascript (prefetch, post fetch, pre-execution scripts) which adds a lot of dynamicity and flexibility to what you are building. Similarly, HI also allows adding more database functions, aggregate functions, charts customization within the applications without any vendor dependence. There are other functions available, such as filters and a filter expression language to build advanced and complex filtering options.

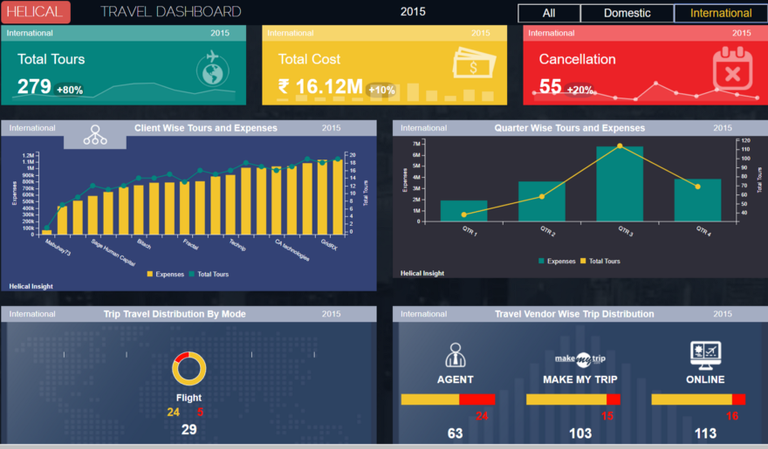
In design mode, the dashboard canvas allows you to drag-drop previously created reports and create a dashboard where you can add images and text components. You can right-click on any component, including a dashboard, report, images, text, input parameter or group, and you will see a lot of customization options that include background color, border, shadow, header, images as background, etc. Alignment options allow pixel perfect position and control of the components. Sticking with their overall philosophy of flexibility, HI allows you to add HTML, CSS, Javascript to each and every component via the right click option on that specific component.
The dashboard canvas makes use of the concept of grouping, which allows you to logically link items and then use them as overlays, and within that overlay, you can define what is in the front and what is pushed to the back. Your typical BI product often only allows a dashboard to be created in a grid mode, which can be limiting, while the HI approach provides a high level of flexibility to create attractive dashboards.
The current selection of input parameter fields are a slider, date range picker, drop down and searchable drop down. I’d like to see a few more added, such as a radio button as well as the option to dock or hide the input controls as they consume a fair amount of display space. I will say that implementing inter-panel communication is quite straight forward though.
The API support in HI is pretty impressive with over 400 API presents. Any company looking for the ability to extensively customize for a white label, these APIs are a huge incentive as the company claims that every piece of the frontend functionality has an associated API, but I was only able to test a few, but they all worked nicely.
Looking at the data access layer of HI, I see that they are hitting the DB directly using standard SQL queries, which means any query that generates a large result set is going to take a while. This can be mitigated if you are doing any prep on your data for BI work, which is often the case for larger companies. If HI were to make more direct use of in-memory storage and processing, it would see some dramatic speed improvements, but you also run into problems potentially where you are blowing off the amount of available RAM. I’m not sure how they solve this in the short term, but that would be a game changer for them.
There is a tagline on the HI website that says “Instant BI”, but I couldn’t find anywhere on the site or the product roadmap where that is defined, so it’s a bit of a mystery. Pricing is also not mentioned on the website, but I asked about it and it was crazy cheap, basically, you are buying help/support and/or a hosted solution since you could use the Apache licensed “Community Edition” Helical Insight CE for free and do whatever you want that is in compliance with the license.
I gotta say, this is a pretty nifty effort, it covers a lot of bases for a lot of people and is preferable to some products I’ve seen in the BI space. I’ve noted some things that I think could be done to the product or possibly be done better, but this is a really solid tool and worth looking at to see if it satisfies your needs before you jump into the deep end of the pool with a commercial product.