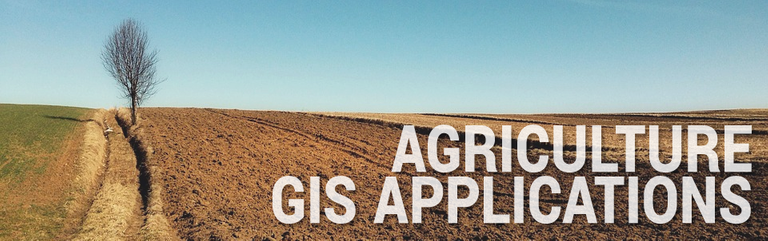
1 Agriculture GIS Applications
- Precision Farming – Harvesting more bushels per acre while spending less on fertilizer using precision farming and software. (How to win the farm using GIS)
- Disease Control – Combating the spread of pests through by identifying critical intervention areas and efficient targeting control interventions.
- Swiss Alps Farming – Cultivating south-facing slopes in the Swiss Alps using aspect data because it shelters from cold and dry winds which is critical to successful crop growth.
- 3D Scanners for Biomass – Measuring with laser accuracy 3D biomass using the FARO scanner.
- Real-time Crop Yields – Shifting to real-time crop monitoring and targeted, automated responses with drones and precision watering sensors.
- Current Food Security – Safeguarding food insecure populations by establishing underlying causes through satellite, mobile-collected and GIS data storage.
- Agri-tourism – Navigating through crop mazes with GPS receivers in the developing field of agri-tourism.
- Plant Hardiness – Defining distinct boundaries in which plants are capable of growing as defined by climatic conditions.
- Machine Performance – Logging geographic coordinates of agricultural machinery in a farm field to better understand the spatially variability cost of field operation and machinery performance.
- Future Food Demand – Diagnosing the future food demand and planning how to fulfill the needs of a growing and increasingly affluent population.
- Crop Assimilation Model – Simulating soil, water and crop processes to better understand crop productivity and monitoring using the Crop Assimilation Model tool in GRASS GIS.
- Water Stress – Balancing the ratio of local withdrawal (demand) over the available water (supply).
- Historical Agricultural Land – Plotting the historical and future farming trends served.
- Hunger Map – Raising awareness about global hunger and places that are in need.
- Agromap – Breaking down primary food crops by sub-national administrative districts and aggregating by crop production, area harvested and crop yields.
- Crop Resilience to Climate Change – Adapting to climate change and shifting weather patterns by promote the continued health of your fields.
- Crop Productivity – Calibrating crop productivity using indices like Normalized Difference Vegetation Index (NDVI) to estimate global crop productivity. (Satellite Image Corporation AgroWatch Green Vegetation Index)
- Erosion-Productivity Impact Calculator (EPIC) – Prioritizing cropland conservation program implementations through “Model Simulation of Soil Loss, Nutrient Loss, and Change in Soil Organic Carbon Associated with Crop Production”.
- Agriculture Capability – Classifying the varying potential for agricultural production using the Canadian Land Inventory.
- Ranch Pasture Management – Collecting soils types, fence lines, roads and other data for better management for more meaningful reports and maps.
- Agricultural Pollution – Quantifying the impacts on climate and the environment from agricultural pollution.
- Agriculture Revenue – Determining the Effective Opportunity Cost relating to deforestation and potential agricultural revenue with IDRISI GeOSIRIS for REDD.
- Irrigation – Capturing irrigation infrastructure for land management decisions more than two-thirds of the world’s freshwater withdrawals are for irrigating crops.
- Farm Preservation – Establishing farm priority zones by analyzing the local farming landscape and constructing criteria for high-quality farming areas.
- Versatile Soil Moisture Budget – Simulating soil moisture conditions of cropland areas taking into account evapotranspiration, rainfall, runoff and other factors.
- Drought – Minimizing the impact of drought by analyzing the spatial distribution of rainfall and real-time sensors like SMAP, SMOS and synthetic aperture radar.
- CropScape – Estimating acreage of crop types and spatial distribution using satellite imagery with National Agricultural Statistics Services. (USDA NASS CropScape)
- Crop Forecasting – Predicting crop yields using NDVI, weather, soil moisture, soil types and other parameters.
- Organic Farming – Managing various sources of data for organic farming permits including tillage history, field inputs, crop rotations, and pest management measures on a field-by-field basis.
- Agricultural Non-Point Source (AGNPS) Model – Predicting the effects of agriculture on water quality using Agricultural Non-Point Source pollution model in MapWindow
- Drainage Ditches – Tracing farm field drainage lines using stereo imagery in MicroImages TNTMips. (TNT Stereo Viewing Tools)
- Length of Growing Period – Meeting the full evapotranspiration demands of crops when average temperatures are greater or equal to 5°C and precipitation plus moisture store in the soil exceed half the potential evapotranspiration.
2 Astronomy/Planetary GIS Applications
- Asteroids – Gazing the sky and tracking asteroids with NASA’s bolide events map. (NASA’s Bolide Events)
- Mapping Mars with MOLA – Start mapping a whole entire new planet using NASA’s MOLA. (USGS Planetary GIS Web Server – PIGWAD)
- Mars Terrain – Going for a spin on the rugged terrain of Mars using data captured by the Mars Orbiter Laser Altimeter (MOLA) instrument on the Mars Global Surveyor (MGS). (Mars Terrain)
- Mars Rover Landing – Examining how to landing the Mars Rover safely with operations criteria including latitude for solar power, soil softness, slopes using laser altimetry, dustiness, rockiness and a landing footprint.
- Water Flow on Mars – Hillshading the Mars Digital Elevation Model to augment legibility and understand where rivers may have flowed and oceans flourished. (Mars Water Flow)
- Satellite Orbits – Gazing the sky for satellites and even programming satellites for image acquisition. (Satellite Map)
- Magnetic Fields – Investigating magnetic field lines in 3D with international geomagnetic field maps.
- Astrogeology – Delivering planetary mapping to the international science community in public domain – from planetary topology to lunar geology. (Astrogeology Science Centre)
- UFO Sightings – Speculating UFO sightings with proportional symbols with over 90,000 reports dating back to 1905. m
- Light Pollution – Recognizing the artificial light introduced by humans in the night sky and how it interferes with the observation of stars. (NOAA’s VIIRS data) / Light Pollution Map)
- Mars in Google Earth – Searching for Martian landmarks with Google Earth’s “Live from Mars” layer.
- International Space Station – Tracking the real-time location of the International Space Station (ISS) in ArcGIS Online Data.
- Venus – Mapping the altimetry, shaded relief and geology of Venus. (Venus Map)
- Magnetic Declination – Positioning with the magnetic declination, a varying angle from a true geographic north using NOAA National Geophysical Data Center 2015 data and the Magnetic Declination QGIS Plugin.
- Gravity Anomaly – Understanding our Earth’s gravity by mapping the unusual concentrations of mass in a different regions on Earth. (The Geoid)
- NASA Visible Earth – Cataloging images and animations of our home planet in the electromagnetic spectrum from various sensors. (NASA Visible Earth)
- Tycho – Mapping Tycho, the youngest moon crater.
- Milky Way – Surveying the inner part of the Milky Way Galaxy with GLIMPSE (Galactic Legacy Infrared Midplane Extraordinaire)
3 Archaeology GIS Applications
Lost Cities – Revealing lost cities in the ground and their forgotten past using ground penetrating radar and infrared sensors. (LiDAR uncovers lost cities)
Archaeological Survey – Tackling a huge problem archaeologists face every day – collecting physical locations of their excavation findings from a wealth of sites.
Middle Eastern Geodatabase for Antiquities – Recording, monitoring, and protecting archaeological sites to avoid impacting, factor cost for site mitigation – developed by the Getty Conservation Institute (GCI) and the World Monuments Fund (WMF). (MEGA Geodatabase)
Geographic Text Analysis – Incorporating a semi-automated exploration of large written texts combining Natural Language Processing techniques, Corpus Linguistics and GIS.
QGIS Archaeology Tools – Computerizing the archaeological community with their record keeping with the pyArchInit QGIS plugin.
Mediterranean Landscape Dynamics – Modeling surface process change and landscape evolution to better understand the long-term interactions of humans and landscapes in the Mediterranean using GRASS GIS. (Mediterranean Landscape Dynamics)
Preliminary Site Investigation – Searching ancient maps for buildings, cemeteries, roads and fences as these sites present important clues to archaeological sites. (Archaeology Site Investigation)
Stone Tools – Characterizing geographic features suitable for making stone tools and clay pottery such as lithic materials, water resources, stream hydrology with geologic controls like bedrock outcrops and drainage basin floodplains.
Viewshed – Scoping out a site by determining what is within eyesight considering all prehistoric conditions associated to that viewshed.
Archaeological Site Prediction – Connecting favorable slope, aspect, geology, hydrology and distance to water using the Multiple Criteria Evaluation (MCE) to predict archaeological sites.
Cultural Heritage Inventory – Customizing and deploying the collection of cultural heritage field observations with open source geospatial software Arches. (Arches Heritage Inventory & Management System)
3D Archaeology – Rendering accurate and efficient 3D recordings of archaeological heritage sites, in particular archaeological excavations with aerial imagery and 3D environments.
Shovel Test Pits – Logging transects, shovel test pits and other recordings when they visit potential locations to conduct field investigations.

Predicting Dinosaur Tracks – Getting the inside track on understanding exactly where dinosaurs once roamed the Earth with vegetation coverage, slope, aspect and proximity to landslides.
4 Architecture GIS ApplicationsLine of Sight – Planning high-rise buildings so they don’t obstruct the view of the mountains in Portland using line of sight.
Exposure to Noise – Orchestrating urban mobility plans with special consideration for the impact environmental noise using OrbisGIS. (Urban Noise)
Development Planning – Making citizens happy through smart development planning and understanding the bigger picture.
Crowd Simulation – Mastering the collective dynamics of interacting objects in urban phenomena at the scale of individual households, people, and units of real estate and at time-scales approaching “real time”. (Crowd Simulation)
Solar Exposure – Harvesting light to assess the suitability of installing solar (photovoltaic) panels on roofs using 3D city models and geometric information such as the tilt, orientation and area of the roof.
City Engine – Assessing feasibility and plan implementation using Esri’s City Engine improving urban planning, architecture, and overall design.
Pedestrian Behavior – Discerning the movements of pedestrians and urban behavior throughout through a plaza in Copenhagen.
Shadow Analysis – Diagnosing how much shadow will be casted in the pre-construction phase onto its surrounding using Bentley Map.
Parking Availability – Orchestrating a parking available by collecting the percent of spaces occupied versus search time.
Integration of GIS and BIM – Operating a facility with BIM (building information modeling) because of its ability to analyze information and integrate data from different systems.
Tangible Landscape – Experimenting with the potential impact of different building configurations with an easy-to-use 3D sketching tool. (Tangible Landscape)
Geodesign – Conceptualizing building plans with focus on stakeholder participation and collaboration to closely follow natural systems.
Propagation of Noise in Urban Environments – Modelling 3D data to answer how urban citizens are harmed by noise pollution, and how to mitigate it with noise barriers.
Space Utilization – Augmenting NASA’s Langley Research Center by applying optimization algorithms to space utilization. (Space Utilization)
Ordnance Survey Geovation – Pioneering location innovation in the United Kingdom through Geovation – the collaboration, exchange of ideas and inspiring innovation. (Ordnance Survey Geovation)
Hi! I am a robot. I just upvoted you! I found similar content that readers might be interested in:
http://gisgeography.com/gis-applications-uses/
upvoted, commented and followed