Bitcoin
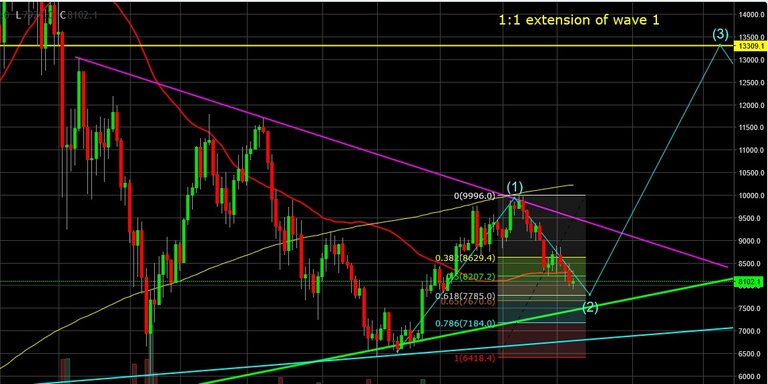
We could finally be at the closing stages of the Bitcoin correction as the price inches closer to the magical 0.618 Fibonacci level. Even though the 0.618 Fib level is touched astonishingly often, it's not guaranteed to do that. Anything between 0.5 and 0.618 is usually a good level to add to long-term positions.
4-hour chart

Looking at the daily chart below you can clearly see that the correction has been significant, and we should be very close to starting the third wave (if we haven't already). The following days and weeks will show us whether that wave is going to complete successfully or not, but I'm expecting a retest of the purple line quite soon.
Daily chart

Cardano
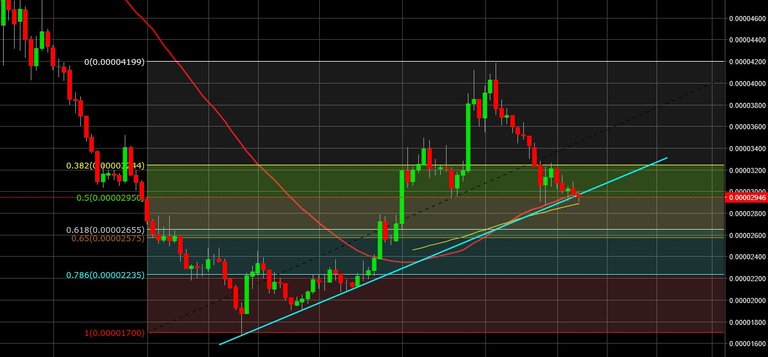
Cardano has been surprisingly resilient during the last couple of days. There are massive buy orders at 2900 sats which have definitely helped keep the price above the 200-day moving average. The price now seems to fall below the trendline but as long as it stays above the moving average, there's no reason to panic. I would sell if the price falls below 2900.

Substratum
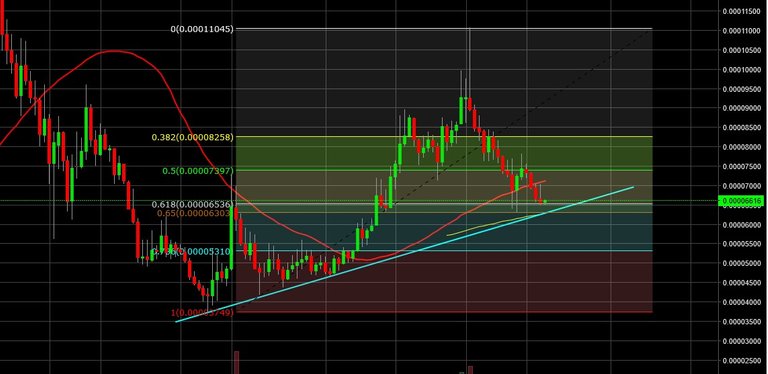
Substratum's chart looks ridiculously similar to Cardano but with a more handsome correction to the 0.618 Fibonacci level. The price is also supported by a trendline and the 200-day moving average.

POA Network
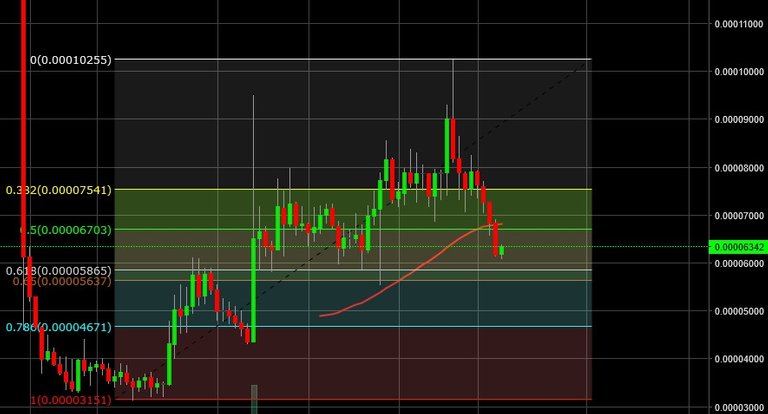
POA has been on the markets only a couple of months, and it's still below its ICO value. Just like the two projects above, this also shows clearly five waves up and a very healthy correction. The price got close to the 0.618 Fib level, but it already seems to have found some support where wave 1 and wave 4 previously ended.
To me, these are the most attractive projects from a technical perspective at the moment. Do your own research before buying anything.
