Good Day People. This will be my first post. I am a crypto trader like many of you - and therefore I hope to share my opinions based on my research
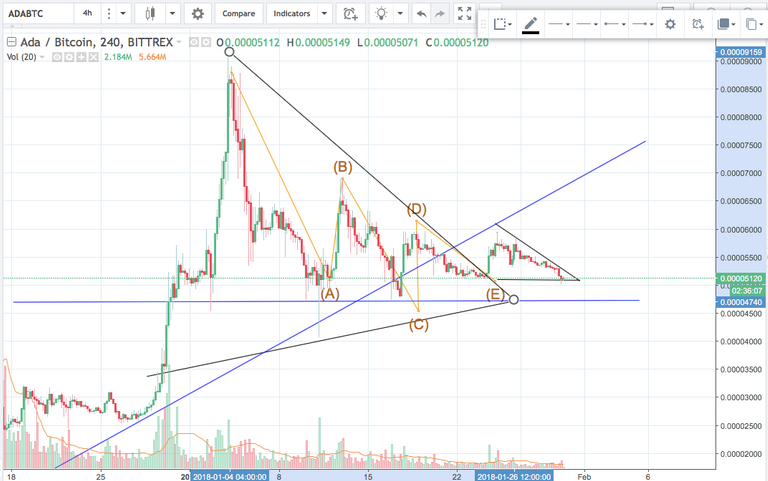
So what we have below is a 4 hour chart of Cardano....
-You will notice that it was in a symmetrical wedge, where it completed all waves and then broke out and is now moving sidewards.
- Candles have fallen through the long term trend line which was quite an aggressive upwards direction.
The horizontal blue line indicates a major support which we could test as the MACD indicates that there is no sign yet of a turn around.
My concern is that the more we test the major support the more likely we are to break it.
We just need to ride this out until the market correction ends which has to start with Bitcoin.
Let me know your thoughts.