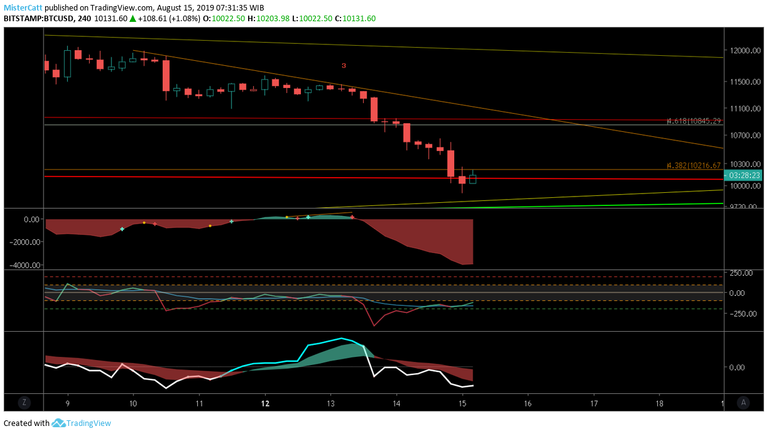
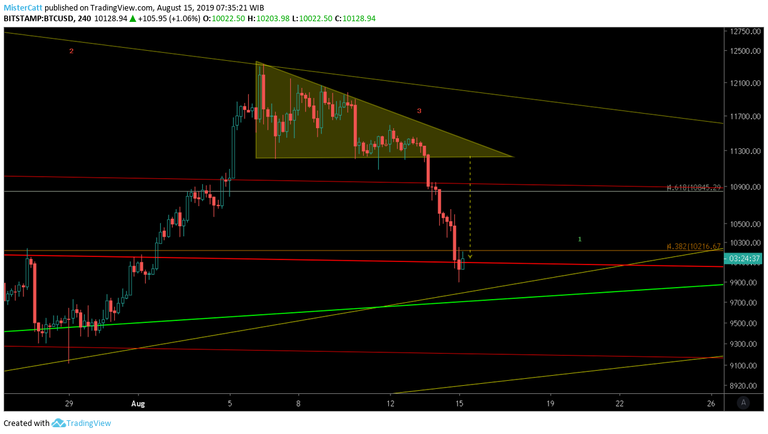
Short term ; Support 9700 & 10000 || Resistance 10200 & 10500.
Downfall of BTCUSD is expected to be occur after the break down the short term of support yesterday and Descending triangle pattern is already reach it's target at 10000. BTCUSD somehow manage to bounce back for a while after the price action hit 9888 price. now i expect it consolidate around 10000 area before it decide whether it could continue or reverse trend for short term.
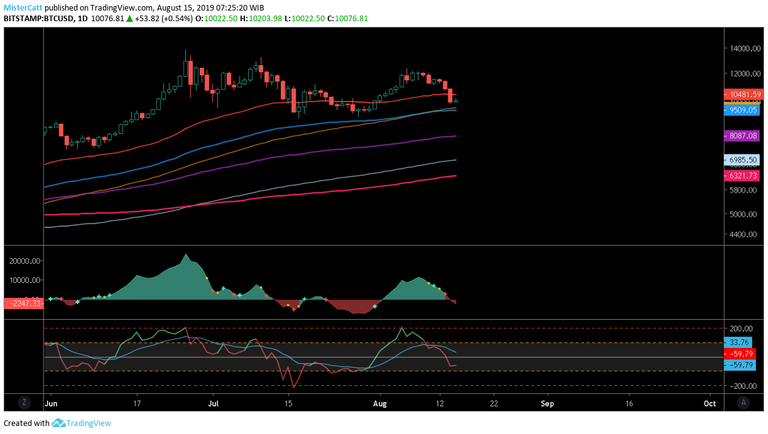
Most timeframe is bearish. Daily chart looks very bad as it's beginning to switch toward a bearish trend on medium term, see the indicator are ready to switch trend from OBV and CCI. Jeopardize bullish trend for a medium term.
From daily itself, support is expected to be around SMA 100 (+-9700) and EMA 100 ( +-9500) let see if it could hold above it for couple of week.
Indicators on 4 hours looks very bearish. Also oversold (RSI)
.png)
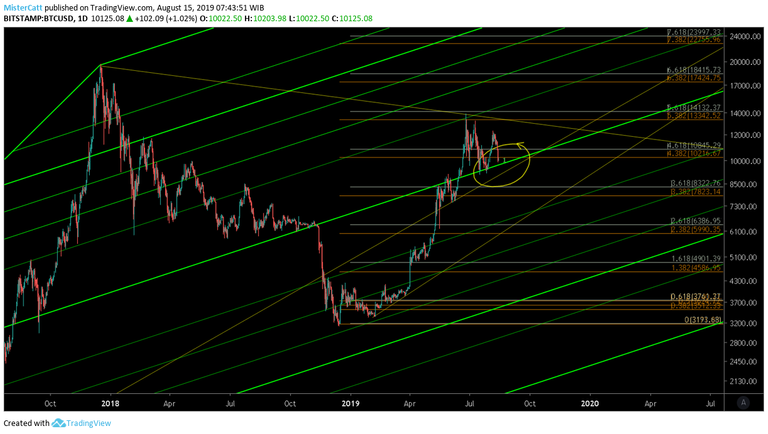
Looking at OBV a massive bearish momentum, CCI tell a bearish trend is on effect and CMF is still making a lower low along with price action which no definitive turn of effect just yet.I expect a bounce on support somewhere around 9500 - 9700 according pitchfork (green) from which drawn from 2015. This pitchfork also coincide with 100 EMA + 100 SMA on daily chart which right around 9500 - 9700 acting as a hard support/resistance and if the price action break past below this pitchfork i expect a major bearish continuation occur for medium term on BTCUSD. Same scenario occur like when BTCUSD break 6k support on 2018 which is coincide with current price action about to break it or bounce from it.
Thank you for your time to read this post and please take this idea as a grain of salt as reality always differ from what i expect as this post merely just an opinion.
and please feel free to share what your thought on comment section.
peace.
.png)
.png)
.png)