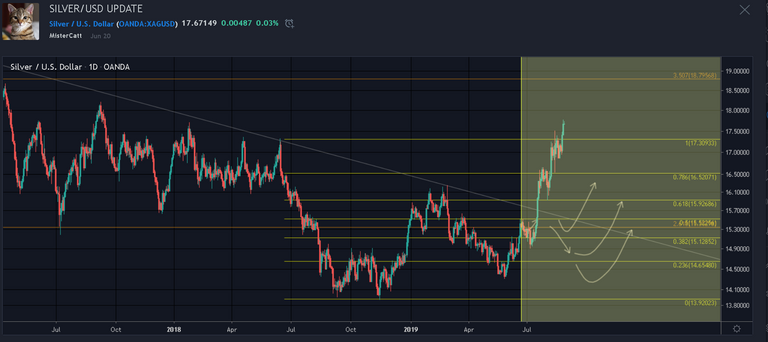
Medium term ; Support 16.5 & 17.1 || Resistance : 18.00 & 20.00.
- Silver/USD is quite parabolic recently since my last chart. Although i expect a retracement due to bearish divergence is already sighted on daily chart. I'm using OBV, Stochastic RSI, RSI & DMI.
I still believe around 18.00 $ to be the precise target for me personally to be a resistance and pull back/consolidate for a time being before it's start another rally toward 20 $ .
Keep in mind DMI is on high level for bullish trend which is another attempt for price action to rise is always expected while it must aligned with price action movement with momentum & volume indicator to negate the recent bearish divergence. Which create similar higher high than previous high on most indicators with Price action.
Thank you for your time to read this post and please take this idea as a grain of salt as reality always differ from what i expect as this post merely just an opinion.
and please feel free to share what your thought on comment section.
peace.

.png)
.png)