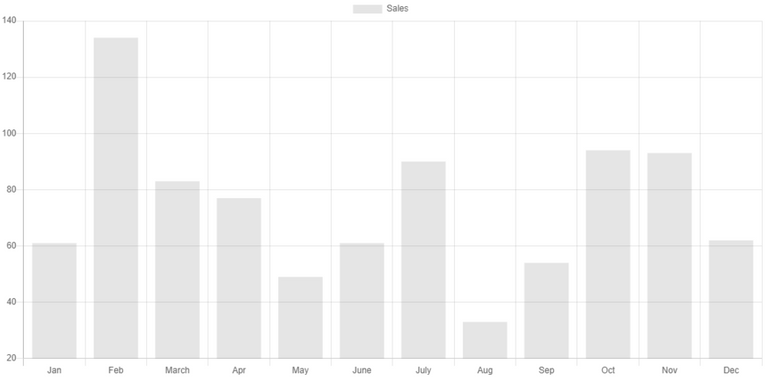
最近尝试开始使用React,发现真的非常好用。这次尝试了在一个单一的页面中使用React+Chart.js来生成基本的报表。这里并没有创建一个完整的React项目。其原因在于,在现有的一个基于Java(后端)+JQuery(前端)的项目中只需要添加一个页面,只在该页面中使用React。下面把步骤记录一下:
创建HTML页面
首先创建一个非常简单的HTML页面,但需要引用相关的js库,比如react, react-dom, babel, chart.js等
<!DOCTYPE html>
<html lang="en">
<head>
    <meta charset="UTF-8">
    <title>Statistics</title>
    <script src="https://unpkg.com/react@16/umd/react.development.js" crossorigin></script>
    <script src="https://unpkg.com/react-dom@16/umd/react-dom.development.js" crossorigin></script>
    <script src="https://unpkg.com/babel-standalone@6/babel.min.js"></script>
    <script src="https://cdn.jsdelivr.net/npm/[email protected]/dist/Chart.min.js"></script>
</head>
<body>
    <div id = "my_statistics">
    </div>
    <script type="text/jsx" src="statistics.js"></script>
</body>
</html>
在Javascript中使用React和Chart.js
接下来需要定义一个组件,比如叫做:BarGraph
class BarGraph extends React.Component {
    chartRef = React.createRef();

    componentDidMount() {
        const myChartRef = this.chartRef.current.getContext("2d");

        new Chart(myChartRef, {
            type: "bar",
            data: {
                labels: ["Jan", "Feb", "March", "Apr", "May", "June", "July", "Aug", "Sep", "Oct", "Nov", "Dec"],
                datasets: [
                    {
                        label: "Sales",
                        data: [61, 134, 83, 77, 49, 61, 90, 33, 54, 94, 93, 62],
                    }
                ]
            },
            options: {
            }
        });
    }
    render() {
        return (
            <div>
              <canvas
                id="myChart"
                ref={this.chartRef}
              />
            </div>
        )
    }
}
接下来,需要引用这个组件
'use strict';
const e = React.createElement;

const domContainer = document.querySelector('#my_statistics');
ReactDOM.render(e(BarGraph), domContainer);
至此,就能看到如下效果了:
但需要注意的是:
1)在测试这个页面的时候,需要将其放置在web服务器的目录下通过http的方式来访问。
2)这里使用固定的数据来画图,但在真正使用时一般都是通过对API的调用动态获取数据的。

Hi, @aafeng!
You just got a 0.91% upvote from SteemPlus!
To get higher upvotes, earn more SteemPlus Points (SPP). On your Steemit wallet, check your SPP balance and click on "How to earn SPP?" to find out all the ways to earn.
If you're not using SteemPlus yet, please check our last posts in here to see the many ways in which SteemPlus can improve your Steem experience on Steemit and Busy.