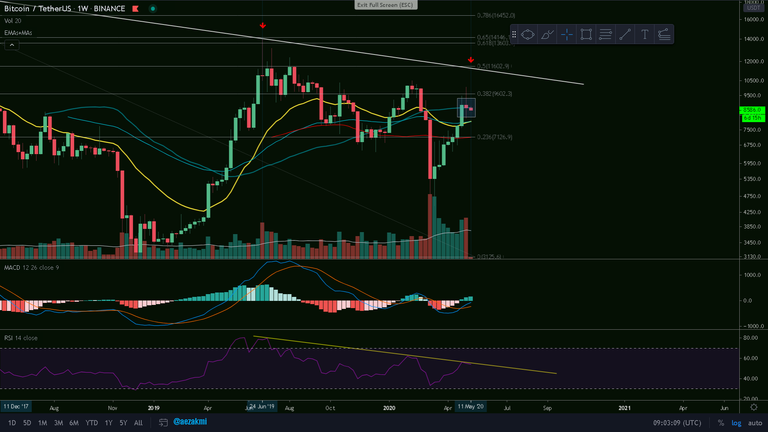
BTC/USD Weekly Chart
With yesterday's sudden drop, we closed the weekly candle right at the 50 MA and started the new one downwards. We have some 25% room left to reach the $11k levels and I think it is still doable. In my previous post I mentioned that the $11500 level is an attractive target and a possible great short entry and I'm holding my opinion; I still believe that we could have a candle wick reaching that specific target. We have the RSI fighting at a descending trend line and could have it reach near the upper reference line in case of the $11500 price action. Closing the weekly (preferably monthly) candle above this level, would probably put us in a new bullish cycle.

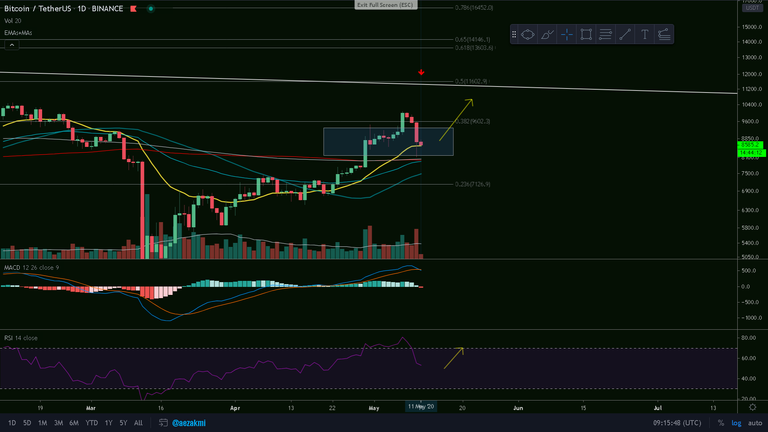
BTC/USD Daily Chart
On the daily we just reached the 21 EMA (yellow), with yesterday's candle wick extending to the 200 MA. Getting a higher high on the price, with a lower low on the RSI and MACD, would be perfect.


Thanks for reading and safe trading!✌
If you find this post useful, please:

You are not alone in the upside view. I know many who are targeting the $11K-$12K area.
Posted Using LeoFinance
Well.. I'm very curious about what will happen when we'll reach this target.
I think it depends upon how it gets there.
Going directly to that level, then it might be a pullback. If there is a pullback before we get the $11K range, then it will likely just be part of a trend pushing things higher and could test the $14K level.
Posted Using LeoFinance
Well, closing above the $11500 level would mean breaking the two and a half years long descending trend line. We need some serious momentum to do this.
I agree with that sentiment. It will have to be very powerful.
That is why we could see a pullback a bit to try and build momentum.
Posted Using LeoFinance