If you’d rather see this presented in video form, you can view the replay of the live stream I host every Sunday night:
Last week, I called for a bearish reversal noting, “We should now be completing the fourth wave and soon starting the last major leg down.”
We have since seen that reversal and it is now highly likely that we get a major capitulation within the next 2-3 weeks. And in the next week, I expect mostly range-bound action, though it is possible that we see the start of capitulation near the end of the week.
Before I get into more detail about that, here is the daily chart:

Nothing has changed on the bigger picture:
The “ideal” end of this correction is at $4800 with the possibility of extending to $3100. If $3100 is broken decisively, crypto may not recover for a very long time. But to be clear, I do not expect this to happen. We should see the higher targets of $48k to $82k before $3k.

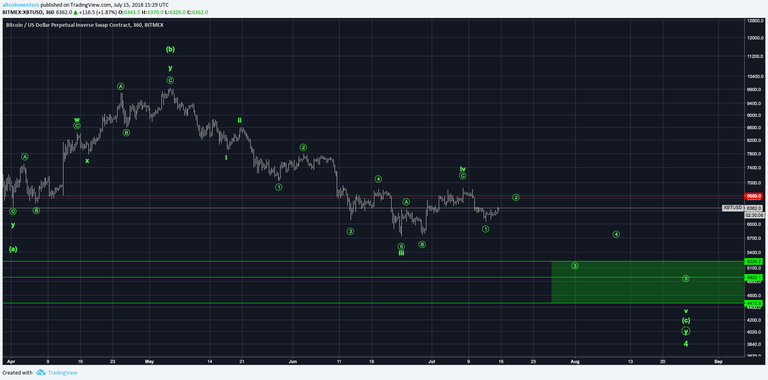
On the 6 hour chart, you can see that we have most likely seen the first wave down in this final fifth wave. The size of this wave one aligns well with the larger-time frame targets of $5200 to $4500.
At this time, I do not have any alternate bullish count that is likely enough to be presented here. Above $6900 and I will have to reconsider this.

The 90 minute chart shows more detail on the structure of the move down off the local high of last week: clearly impulsive. The corrective move up has satisfied the minimum length of a wave two at the 38.2% retrace, but still remains structurally incomplete. There are two likely ways that Bitcoin could complete this retrace, but both lead to the same place: $6450 to $6550.
If we see weakness in that range, I will be going net short with a stop loss of $6870 (previous high) and the first warning being a strong break above red line at $6670.
Historically, Bitcoin has tended to extend in fifth waves, so I strong recommend that you hedge at least some of your long term holdings. I go into more detail on that in our previous video here.

This is a chart of the correlations between various cryptocurrencies. Almost everything is making or close to making a new all time high. This is the reason why we are not yet choosing to focus these emails on specific altcoins: 99% of the market looks exactly like Bitcoin!
But once we get a bull run started, these correlations should start to come down again and we will be taking a look at individual altcoin charts.
UPDATE: Having now broken above $6670, there is now a viable bullish alternative. But it is not confirmed until a new local high is made above $6870. This is invalid with a strong break below $6400.
If this analysis has been helpful and you want to receive it in your inbox every Sunday, you can sign up at https://altcoinmentors.com/strategy. If you would like to support us, please upvote and share this article with someone else who would find it useful!
To keep up with us during the week, we have a Telegram Channel where we post charts, market updates, and trade ideas every day! You can join by going to https://t.me/altcoinmentors.
Happy trading!
Charlie You
Altcoin Mentors, Inc.
twitter.com/iamcharlieyou
twitter.com/altcoin_mentors
Congratulations @charlieyou! You have completed the following achievement on Steemit and have been rewarded with new badge(s) :
Click on the badge to view your Board of Honor.
If you no longer want to receive notifications, reply to this comment with the word
STOPDo not miss the last post from @steemitboard:
SteemitBoard World Cup Contest - The results, the winners and the prizes