Remember that I am new to Crypto and am trying to come up with money to buy a catamaran
This is not financial advice
Am actually looking for advice or critique on how I am looking at the Data
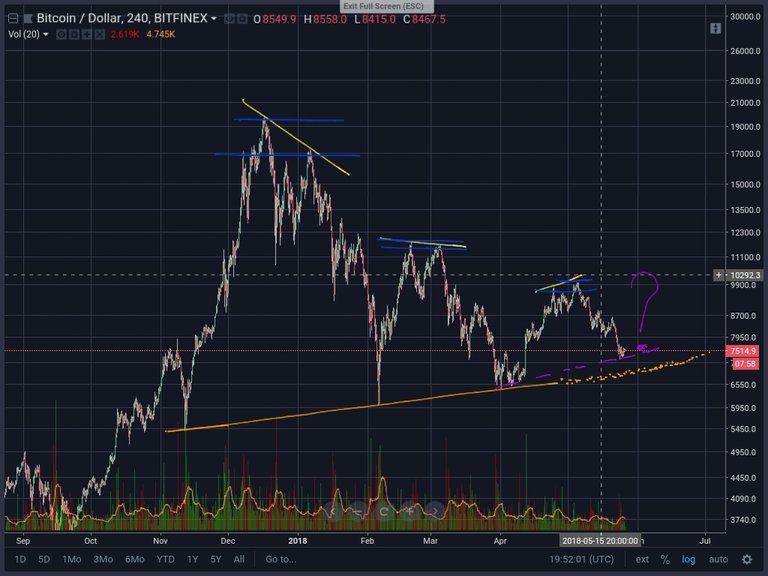
The bottom "Orange" trend line
On the 4hr chart, it's toutched 3 times - it could toutch again or not at all
Could the purple deviation from the orange be a change in direction??
It blue is the difference in the double peaks
The 1st two are in a downward direction shown in yellow and the 3rd is in an upward direction
That is certain - it's now history
Weather the bottom is the purple line, or the old trend line in Orange, only time will tell
Stochastic is about to cross and come down, however the RSI has moved off the bottom of a few days ago
Sort: Trending