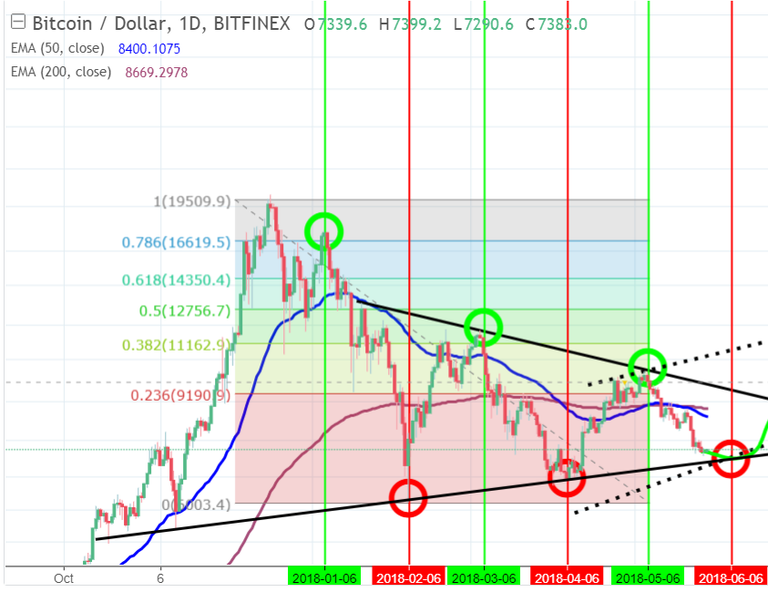
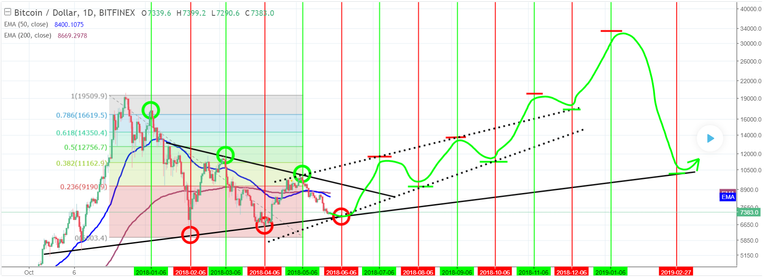
Looking at BTC vs USD on the daily log chart do you notice anything interesting?
If it's not that clear I will point if out... Since the 6th of January, the 6th of each month has been the pivot point for alternating high and lows... What does this mean? Well, if this trend continues it is likely we will find our next bottom on the 6th of March around 7100 before our next run up. Given we will be 3/4’s of the way through the symmetrical triangle this would also coincide with the ideal point to break out to the upside of the symmetrical triangle and send us higher.
For shits and giggles I have consulted my crystal ball and added in support and resistance areas for what could potentially play out if this trend of alternating high’s and lows on the 6th of each month continues…. Assuming this happens; then we form the hypothetical dashed uptrend channel climaxing in a rapid bull run between 6th of December to 6th of January 2019 where we will reach a new ATH of 33,330. We will then retrace 69.429% to 10,000 by 27th of Feb before the cycle continues in 2019 (but this time on the 28th of each month rather than the 6th).


I very like analysis articles. UpVotedand follow
Hope you will view my post and follow me. i will upvote for your articles in the future.
Hi! I am a robot. I just upvoted you! I found similar content that readers might be interested in:
https://www.tradingview.com/chart/BTCUSD/38v3Dnec-BTC-vs-USD-and-the-Law-of-6-s/
Yep, that is also my content! :)