Zane’s Crypto Chart Spotlight: PinkCoin (PINK)!
Welcome back Traders/Investors/Chart Enthusiasts/Everyone!
This 3rd edition covers PinkCoin (PINK).
A quick look at this coin’s purpose directly from their “Pink Paper” reads:
“...intend to change the landscape of charity crowdfunding, casual tipping, and friendly neighborhood micro-donation campaigns”
It’s an interesting idea and also an interesting chart:)
My Goals:
To provide timely, high quality technical analysis.
Help with becoming more comfortable with understanding the sentiment of a chart.
To put my knowledge to the test in working hard to filter thru the crypto world to find charts that I believe have a great chance of continuing their trend.
Locate Smart Entry Zones so you can worry less about a stock reversing on you.
Locate Expected Exit Zones so you aren’t holding too long or exiting too early.
Coin: PinkCoin


What I’m Seeing:
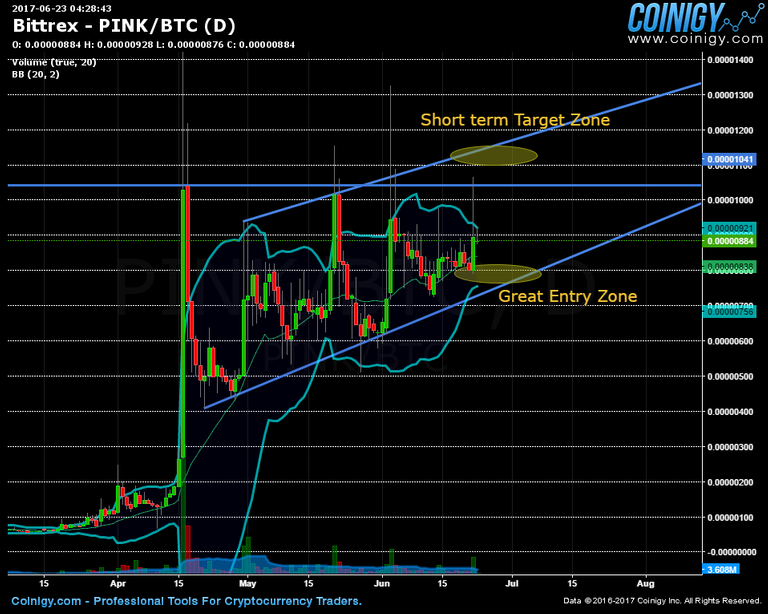
Strong breakout began this upward channel trend. Since then it has kept making higher lows and higher highs. I don't see any warnings on the chart so it should be smooth sailing until we get a break below the blue trendline that stays below it for multiple days.
Bollinger Bands are tightening signalling an expansion in the near future. You could say that it just started to try and break out higher today. That's why this chart made the Spotlight today!
Entries:
Shown on the chart in the lower orange oval.Also, buying anywhere near the lower blue trendline would also be a very good entry location.
Next Major Targets:
Target area 1: .00001041 BTCTarget area 2: the upper orange oval ~.00001100 to .00001150 BTC
Target area 3: Follow the upper blue trendline over time.
Downside Outlook:
If we see a move below .00000725 BTC then that will be the first sign of this trend slowing down.Thank You!
I hope you enjoyed this breakdown. Let me know what you think about my review.
Which coins do you think are about to move? Comment below!
I look forward to your comments! If you enjoyed this please follow and up vote!
Thanks,
Zane