- Fundamental Analysis:(long term trading) : Establishing Crypto' Intrinsic value.
1.1 Blockchain Metrics :
a) Hash rate : Combined computers power to perform calculations.
The higher the hash rate the more miners are there and more reliable the blockchain is; the lower, the lesser the investors' interest.
b) Status and Number of Active addresses : Total number of sending and receiving addresses and the number of unique addresses in the blockchain over various periods of time (days, weeks and months) to gauge growth or decline.
c) Transactions values : Total number of transactions per period indicates steady circulation
d) Transactions fees : Represent the demand on the blockchain, their gradual increase shows how reliable the coin or token is.
1.2 Financial Metrics :
a) Market Capitalization (Market Cap) : Current price x Circulating supply (also called Network's value).
Seasoned investors see lower Market Cap as a sign of higher potential growth.
b) Liquidity : How easy is to buy and sell the crypto?.
- If there are many buyers and sellers in order books, this narrows the bid-ask spread, which is a strong sign of liquidity.
c) Circulating Supply : Total number of active coins available to the general public, figure that changes over time as coins are burnt, mined or increased by developers.
1.3 Project Metrics : Purpose and operation.
1.4 Background Analysis : Assess credibility of the project' team.
a) Profiles
b) Track records
c) Past experience and accomplishments
d) Relevant early advisors or backers
1.5 Crypto White Paper : Purpose and operation of the project.
a) Blockchain technology solutions
b) Use cases
c) Planned features and upgrades
d) Token economics and sale information
e) Team information
f) Third party reviews
1.6 Project' Road Map : Timeline for test nets, releases and planned features. It is a measure of achievement of milestones for the investor.
1.7 Tokenomics : Supply & Demand.
The higher the demand, the higher the price
The higher the incentives and rewards, the higher the popularity and attention levels.
1.8 Utility : If there is an strong use case, there is more interest and interaction.
1.9 Socio-political environment :
a) Governments decisions
b) Inflation
c) Crisis
1.10 User behavior : Solid numbers of followers and engagement of a project.
a) Social media
b) Crypto community
c) Marketing
- Technical Analysis (short term trading & candlestick chart + volume levels)
a) High volume of trade in shorter time frames are a very good sign.
b) Volume is used to confirm a price' trend : If price has been dropping in shorter time-frames (hours and days) and so the volume levels, this indicates that the downtrend is weak and a bullish pattern may start soon..
c) If price is rising and volume is decreasing, a reversal (bearish pattern) is likely to happen.
d) Support (bottom limit) & Resistance (top limit) :
Sense of Volatility
Direction of Price
When to sell and When to buy
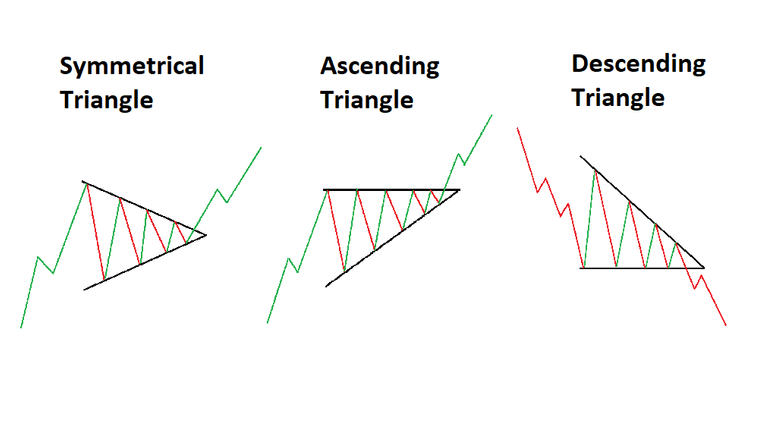
b) Price Pattern : Triangles patterns are considered the most reliable and are formed every time Support and Resistance lines converged.

- Symmetrical triangle : Support and Resistance lines join in forming diagonals and indicates a bullish pattern to follow after price reaches the edge.
Measuring the external distance between Support and Resistance in the triangle, gives idea of the length of the price move up or down.
Ascending triangle : Resistance line is almost horizontal whereas Support line is diagonal and indicates a bullish pattern to follow.
Descending triangle : Resistance line is diagonal whereas Support line is almost horizontal and indicates a bearish pattern to follow.
c) Most Effective Technical Indicators :
- EMA (Exponential Moving Average) :

a) 200 EMA is one of the most important price zones :
If price is below the 200EMA this point is seen as a strong area of Resistance
If price is above the 200EMA this point is seen as a strong area of Support
If a shorter time-frame like 20 EMA crosses the 200EMA from above is a sign of a downturn
If the 20EMA crosses the 200EMA from below is a sign of a uptrend
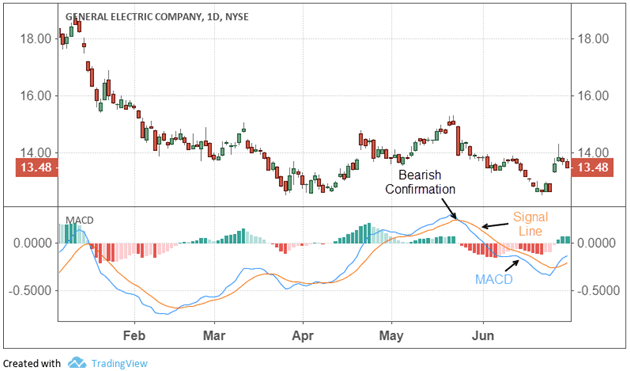
- MACD (Moving Average Convergence Divergence) : Shows trends and volatility.

a) If MACD' lines are closer one another it indicates high volatility and if they are separated, volatility is low.
b) If MACD' lines are crossing each other, it signals a change in the direction of price in the short term, usually pointed by the bars.
- RSI (Relative Strength Index) : Indicates if the crypto is overvalue (above 70, good time to sell) or undervalue (under 30, good time to buy)

- BB (Bollinger Bands) : Indicates volatility

a) The wider the lines are the higher the volatility is which is a good time to sell at the top of the line
b) The closer the lines are the lower the volatility is, which is a good time to buy at the bottom or just below the line
- Sentiment Analysis :
a) Fear & Greed Index : Volatility (V) + Trading Volume (TV) + Social Media Sentiment (SMS) + Bitcoin Dominance (BD) + Google Search Trends (GST).
If V is high, TV is low, SMS is negative , BD is high and GST is low = Fear territory
If V is low, TV is high , SMS is positive, BD is low and GST is high = Greed territory
This index is updated daily.
b) Bull and Bear Index : Focus on BTC sentiment on social media (Bitcointalk.org, Reddit and Twitter), Updated every hour.
If Sentiment is increasing but price is still static, it may signal an opportunity to get in early before price pumps.
If Sentiment is increasing but price is starting to fall, it may indicates is time to sell.
Sentiment + Trend is a more reliable approach
If market is trading sideways and sentiment continues to fall, a reversal is on the horizon.
c) Bison Crypto Radar : Tracks social media sentiment for BTC, BTC Cash, ETH, LTC and XLP in real time.
Left side of the radar is Negative Sentiment
Right side of the radar is Positive Sentiment
d) Santiment : Social media sentiment for more than 2.000 cryptos
e) Lunar Crash : Social media sentiment, engagements, top influencers for more than 2.000 cryptos
- Please Note : As a little compliment to you for reading my article(s), and if you want to earn Real Free Bitcoin by answering surveys, roll the faucet and other easy tasks and competitions, just click my referral link below :
Disclaimer : All the content is NOT financial advise but general information for education purposes. Always do your own research and consult a professional.http://cointiply.com/r/1K7ed
Relevant Websites related to this post :
https://www.livecoinwatch.com/
https://alternative.me/crypto/fear-and-greed-index/
https://money.cnn.com/data/fear-and-greed/?iid=EL
https://www.augmento.ai/bitcoin-sentiment/
https://bisonapp.com/en/cryptoradar/
https://lunarcrush.com/markets?rpp=50&metric=alt_rank&filter=&page=1&col=1&reverse=