Dear friends and traders I want to share with you the graph with candles from 4 hours in tradingview of the pair Bitcoin Dollar, clearly showing that the price of the Bitcoin is approaching the resistance of the exponential line EMA 200, I think that this resistance is key to go r if the price bounces down to seek minimum prices again or otherwise moves into an uptrend again.
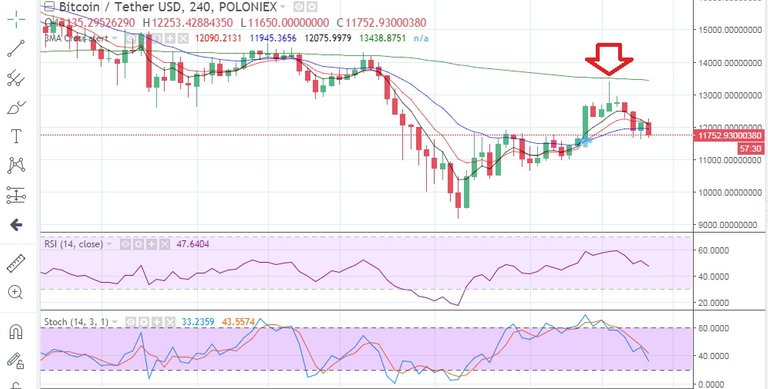
We maintain our position in Bitcoin and are aware of the events.
Steem Bot Tracker websitevote for @yabapmatt for witness!You got a 0.88% upvote from @postpromoter courtesy of @miguelalonso1! Want to promote your posts too? Check out the for more info. If you would like to support development of @postpromoter and the bot tracker please
You got a 68.97% upvote from @yourwhale courtesy of @miguelalonso1!
You got a 2.28% upvote from @minnowvotes courtesy of @miguelalonso1!