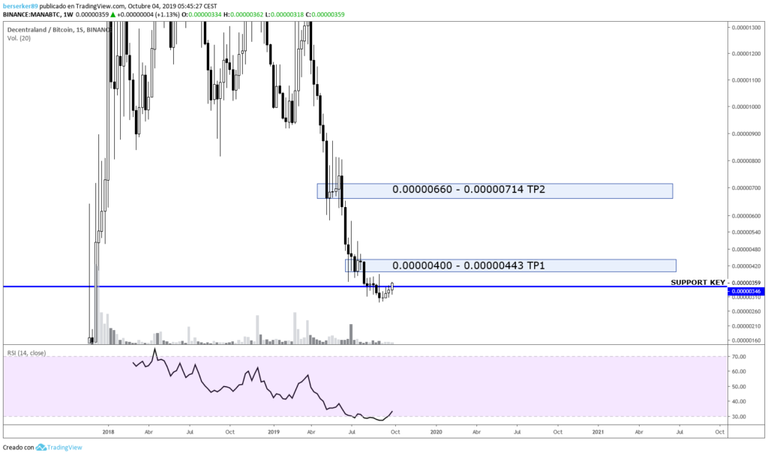

MANA seen from the temporality of 1W we can observe as in the previous LL, the price consolidated support to then make a pullback that we are currently seeing through a series of bull candles, sign of a greater bullish movement ahead, the RSI indicator shows us how the strength of the current momentum is increasing after reaching the weekly oversold zone, a strong signal for the bulls, the price has to recover the key support located at 0.00000346 and confirm it as support to continue looking for our first target which is located within the price range of 0.00000400 – 0.00000443, which should have no problem getting there if it maintains the current momentum.

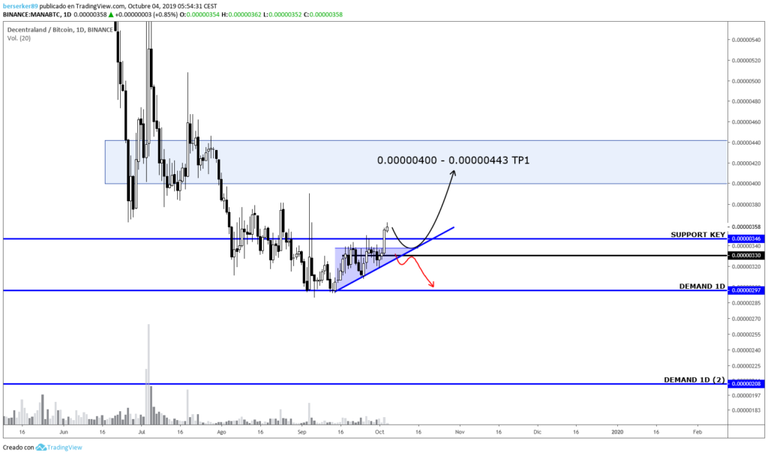
MANA seen from the temporality of 1D we can observe more closely the current movement of candles, we see as before, the price confirmed support through a retest in the horizontal located at 0.00000297, followed by a bullish momentum that through a pair of HL the price is giving a sign of continuing to rise, currently the candle in 1D is finding resistance after making the break of the small upward triangle that I have indicated within the chart above in blue, the price should make a brief retreat to test the key support it needs to recover, and it is very possible that it will fall to the diagonal support indicated by the chart through the dark blue diagonal, if you make this move and find demand in that area, then it is very possible that we will see a next upward momentum towards our first target mentioned above, otherwise, if the price falls below the diagonal support and confirms, we should wait for a major setback to the area of demand located at 0.00000297, which the bulls should defend to prevent the price from falling into the next zone of demand located at 0.00000208.
In conclusion, MANA maintains a series of bull candles within the weekly temporality, which is presented as a strong buy signal, the volume should not take long to arrive, the first step has to be to regain the key support and then confirm a next upward movement towards our first target, if it manages to make that level and take it as support, our second target is located within the price range of 0.00000660 – 0.00000714, I recommend to be very attentive to the action of the price in 1D to avoid invalidations in the movement, wait for confirmation in support to secure long position.
As I always say, you have to be aware of the movement, invalidations can occur, there is no 100% reliable analysis, take your own precautions when trading.
You can follow me on Twitter: https://twitter.com/armijogarcia
Posted from my blog with SteemPress : https://mentormarket.io/cryptocurrencies/mrbullishsail/mana-technical-analysis/
Congratulations @mrbullishsail! You have completed the following achievement on the Steem blockchain and have been rewarded with new badge(s) :
You can view your badges on your Steem Board and compare to others on the Steem Ranking
If you no longer want to receive notifications, reply to this comment with the word
STOPTo support your work, I also upvoted your post!
Vote for @Steemitboard as a witness to get one more award and increased upvotes!