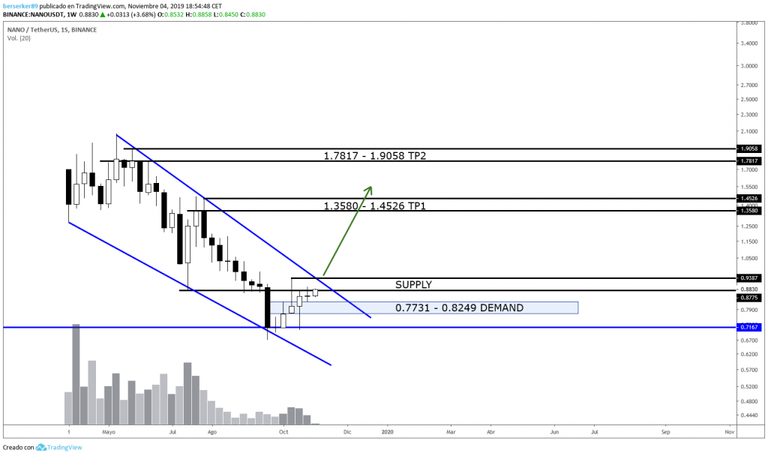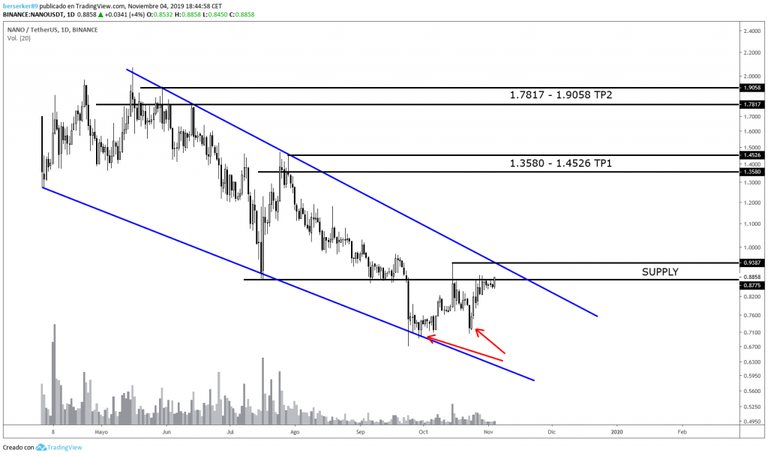

NANO seen from the temporality of 1W we can see how the candle structure has formed a descending wedge where we can see a clear ABC pattern of fall, this type of pattern usually result in a subsequent bullish impulse to point B of the structure, so it is possible that we have a bullish candle close above the level located at 0.8775, then bullish in the next candle, the price has to exceed the supply zone that is located within the price range of 0.8775 – 0.9387, indicated in the graph by the two black horizontal, if the price exceeds that zone by breaking the diagonal resistance indicated in the graph above by the blue diagonal, the price could have a next impulse to reach our first profit target located within the price range of 1.3580 – 1.4526. If the price exceeds that zone by breaking the diagonal resistance indicated in the graph above by the blue diagonal, the price could have a next impulse to reach our first profit target located within the price range of 1.3580 – 1.4526.

NANO seen from the temporality of 1D we can observe more closely the current movement of candles where we see a double floor pattern as a sign of reversal of trend, marked in the chart above by the two red arrows, this pattern can be seen in many other currencies with USDT pairs, signal of the good time in which is BTC, this pattern has caused the bullish momentum towards the testing of the high range located in the area of offer and neckline within the price range of 0.8775 – 0.9387 where we have formed an interesting consolidation below the resistance that could lead to a subsequent break in the resistance of the major figure or a brief retreat into the zone of demand located within the price range of 0.7731 – 0.8249 that we can see indicated in the graph of 1W by a light blue rectangle, the weekly demand zone is located at 0.7167, indicated in the same graph by the horizontal dark blue color.
In conclusion, NANO presents an excellent setup with high probabilities of a much higher bullish impulse towards our first profit target located within the price range of 1.3580 – 1.4526, if the price continued to rise we could also reach our second profit target located within the price range of 1.7817 – 1.9058, the closing of the weekly candle is today, therefore, I recommend to be very attentive to the action of the price in 4H followed by the next candles in 1D to find our best entry position, always remember to place your stop loss to avoid possible invalidations during the movement.
As I always say, you have to be aware of the movement, invalidations can occur, there is no 100% reliable analysis, take your own precautions when trading.
You can follow me on Twitter: https://twitter.com/armijogarcia
Posted from my blog with SteemPress : https://mentormarket.io/cryptocurrencies/mrbullishsail/nano-technical-analysis-2/
Congratulations @mrbullishsail! You have completed the following achievement on the Steem blockchain and have been rewarded with new badge(s) :
You can view your badges on your Steem Board and compare to others on the Steem Ranking
If you no longer want to receive notifications, reply to this comment with the word
STOPTo support your work, I also upvoted your post!
Do not miss the last post from @steemitboard:
Vote for @Steemitboard as a witness to get one more award and increased upvotes!