25 September 2017

Why I hate technical analysis
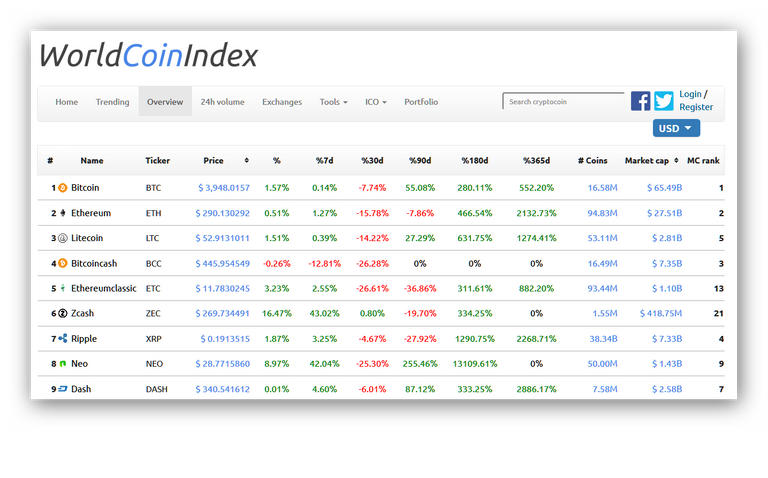
When Bitcoin goes up or down it's in a bubble that's about to burst. When it stays relatively stable (say 0.14% gain in seven days, as on 27 September), it's because no-one's interested.
That seems to be the limit of half the technical analysis you read about cryptocurrencies.
The other half uses charts that are monumentally uninformative: Bitcoin is struggling against resistance at $4000. Ether is finding support at $290.
What do these tell you any more than the figures for the past few days, weeks and months?

Bitcoin's figures are on 27 September: 1.57% (the day) 0.14% (7 days) -7.74% (30 days) 55.08% (90 days).
Ethereum's stats: 0.51% 1.27% -15.78% -7.86%
I don't go back any further because it takes you back into the glory days of crypto frenzy.
From bitcoin and many other cryptos you might get the message: buy and hold for six months and you'll do all right. But if you did that with ethereum your losses would be substantial. And the same goes for Ripple (-27%).
Neo, supposedly a Chinese favourite, is 255% up on three months ago, but 25% down on one month, and nearly 9% up on seven days.
Are investors driven solely by FUD (fear, uncertainty, doubt) and phooey? Or are cryptocurrencies just a game for day-traders?
That ignores the real advantages cryptos offer to people who need something more stable and less state-controlled than fiat currencies (an increasing percentage of the world), plus those who see the benefits of smart contracts and low-cost international transactions of all kinds.
What are they to do for the best?
It' about time for some sociological reporting that actually describes how individuals are acting in uncertain times, when even the prospect of major loss seems better than complete wipeout of your finances. Anyone in Venezuela, Zimbabwe and South Korea?
[This commentary is delayed because I was travelling. I have used the latest figures available at time of writing as well as the historic data which provoked this comment].
Previous days' commentaries
Excel version
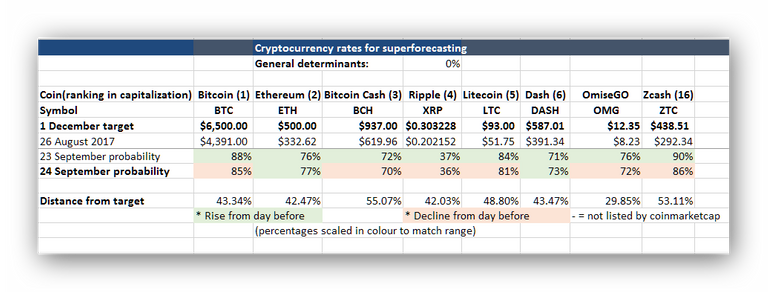
Click here for an Excel 1997-2003 version of this table with records for every day until now, free for download. There's also an Excel version of the shorter summary screenshot used above.
Superforecasting
Indicators
I've listed my seven indicators and explanations of what I consider important here.
awesome post friend.please follow me and vote my post.all time I with you. @nusefile
Congratulations @nusefile! You have completed some achievement on Steemit and have been rewarded with new badge(s) :
Click on any badge to view your own Board of Honor on SteemitBoard.
For more information about SteemitBoard, click here
If you no longer want to receive notifications, reply to this comment with the word
STOP