NEOUSD
Looking at NEO with a swing traders setup while alt coins are up today as BTCUSD broke 8k.
Daily
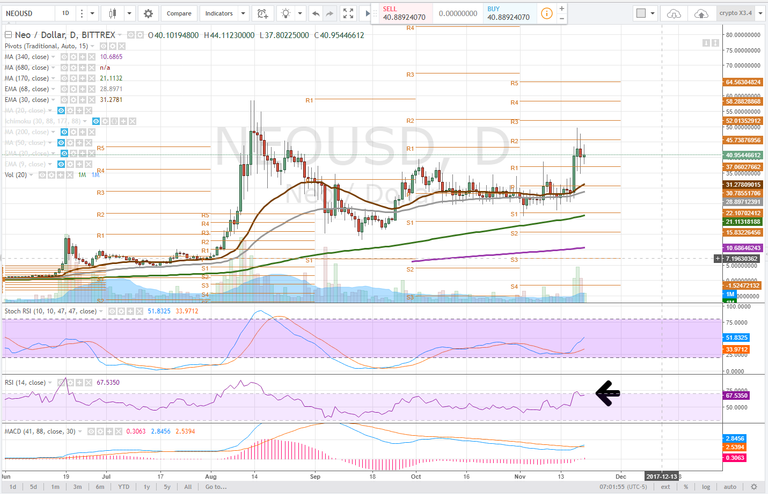
NEO had a bit of a run, appreciating nearly 50% before a phase of consolidation began. If we missed the move, we don't chase, we look for an entry opportunity and learn our levels. It doesn't appear the dip is over but on the daily time frame we can make note of several signs of price progression.
For starters, the price has moved above the moving averages and has so far managed o stay above pivot support R1, $37. Its important for the price to hold this level or a trip to the 30ema (brown) is in store. The 30ema has converged with the pivot and so we look for the low $30 range as a must hold level for bulls to set a higher low.
The candlestick formation itself is forming what appears to be a bull flag so to the upside bulls need to see the price break above and hold pivot r2, approximately $45.
The stochastic RSI and MACD have just turned up and while the bullish momentum has come to NEO the RSI is close to overbought territory. A trend can be defined and traders will look for the trend in the RSI to hold, pushing it into overbought territory. If the RSI begins to correct the price may as well and that's where we look to enter on a dip using a stoploss to mitigate risk. Conversley if it keeps going, we look to add to or start a position on bull flag breakout confirmation.

4 hour
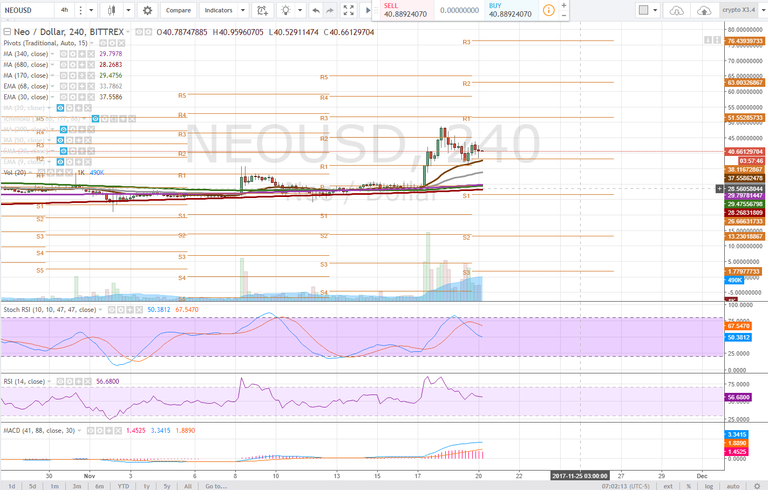
The 4 hour time frame has shown the price consolidating back towards a pivot support as the price stabilizes after such an extreme move. The stochastic RSI has already begun correcting dragging the MACD down towards a bearish curl, tho no bearish cross has occurred. The RSI is trending sideways and indicates selling pressure has not yet hit.
The candlestick formation can be viewed as a head and shoulders pattern with the neckline at approximately $36 - this is a must hold level, and aligns with the 30ema and 4 hour pivot support. These areas are crucial for bulls to hold or the price could slip lower to the 68ema, grey, approximately $28.
Not the convergence of longer period moving averages where the price of NEO took off from, traders will like to see the 170dma (green) pull, conducive to a longer term bullish trend, if the price can find support here and bounce.

1 hour
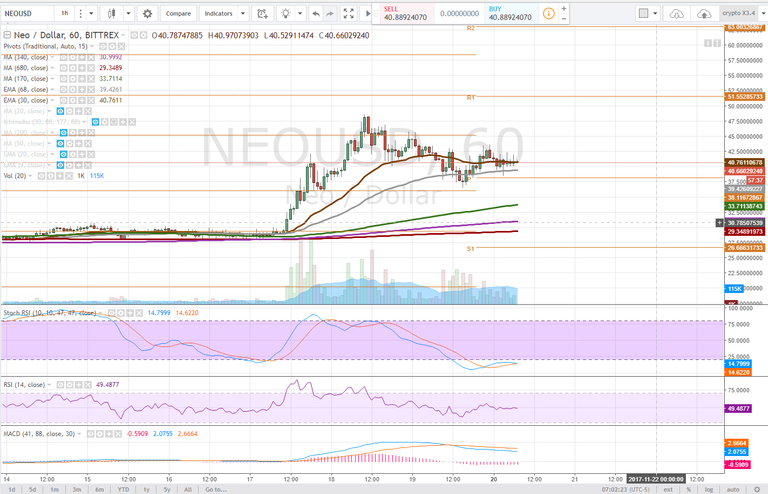
The sotchastic RSI on the 1 hour time frame has already cycled into downtrend with the MACD heading for the zero line. This is something those looking to enter a position should watch for as if the MACD (the momentum behind the price) were to turn up at the zero line we would have a bullish divergence.
The RSI has corrected to the midground and is trending sideways which is neutral.
Bulls need to see the price hold the 30ema on this time frame approximately $40 or we look for support lower as the pivot, $39

Bullish Above: $46
Bearish Below: $35
RISK TRADE: wait until the price tests and bounces off of the 1 hour pivot, approximately $38, set a stop loss, conversely enter a position on bull flag breakout confirmation.
We watch a move like this for entry opportunities or opportunities to short it. We missed the first move but that puts it on our radar for the second. Never chase, wait, plan and have a strategy that will protect you if the chart turns against you. In this case, we are looking to buy off of a support, or on a breakout - looking for the meat of the move.
Don't forget to use stop losses!!!
Previous Articles:
DASHUSD
BTC Vs. BCH
BTCUSD
ETHUSD
BTCUSD
BCHUSD
BTCUSD
ZECUSD
XRPUSD
Follow at your own risk, Not a financial adviser, understand the risks associated with trading and investing. Manage your own Risk - in other words you could lose it all and it's your own fault.

Articulate and well written. Thanks as always, my daily stop.
hey glad to see you around on my feed .. I was thinking of looking you up yesterday, just to say hello .. Ok: Hello
I am going to look more into all of this in the spring hopefully. keep up the posting
Heh sometimes i take the weekend to not even look at a chart.
Thanks for sharing! This is still very hard for me to understand, but certainly very interesting. I just started with crypto a few month ago and so far i restricted myself to some solid ICOs and holding for the long term, selling a bit and taking out my initial investment once i hit 3x/5x. Just took out my initial investment on Power Ledger: Wow what a great project! I think it would be a big mistake trying to daytrade now :) Its just too complex for beginners. I will follow you and try to learn as much as possible from you! Cheers !
Smart, taking out your equity and playing with 'house money' that is how to do it!
Thanks you! Yes, i dont mind holding for the longterm, especially when its house money and i can use my initial investment to buy into some new projects. I mean we are all still pretty early in the game. the big wave of money has not yet flooded the crypto market. i think everything we invest now will easily go 10-50x in the next 5 years so i basically wanna hold at least 100 bucks in each of the promising coins and tokens. I think 1.000.000.000.000$ market cap is achieveable in 2018, we will see. Talk to you soon! Cheers!
Hi, I also recently bought some Neo.
Not bad as it still can claim gas tokens if we put in Neo wallet.
Thx for the thread.
Hope Neo will fly from here.
I'm not saying it won't or will, more so suggesting that we look for entry opportunity with a bias to the upside but manage risk in the process by outlining price thresholds.
There are couple of the annouments regarding the, Join compedition by NEO with Microsoft etc https://neo.org/competition.html . NEO is doing good job, HODLing till Moon :D
oh thats cool! i actually dont bother paying attention to the news, all charts and price alerts
I liked your analysis, especially when you give data about the Risk Trade. Thanks, I already know how long I should wait for the rebound in the pivot
Thanks, that's sort of my goal, provide price thresholds which are independent from the (risk) trade idea.
Glad you find it helpful!
so we see now its fallen close to the bearish threshold
Bullish Above: $46
Bearish Below: $35
need to see it hold this range and retake the pivot. I personally move on from a trade when it doesn't meet my analysis - but i set alerts. This is safer method for most.
how high do you see neo going after breaking previous highs?
IF* it breaks previous highs, you could use fib or pivotology to look for the extension range.
On neo it would be 51, then 58 next possible areas of resistance.
In trading via charts, you must look for price thresholds.
Thanks for sharing! This helped me a lot.
How much NEOUSD do you have ?
at the moment none, would be watching for entry opportunity if at all, stops set. We missed the move, we are watching for extension or not. Would only take positions on confirmation.
Do you think the recent announcement botch is going to have much affect on this analysis?
Price leads!
Thanks for the analysis. As for me investing in xrypto has been unfavorable for me. U have lost alot. Just wanna stick to steem for now.