Great analysis. Double thumbs up.

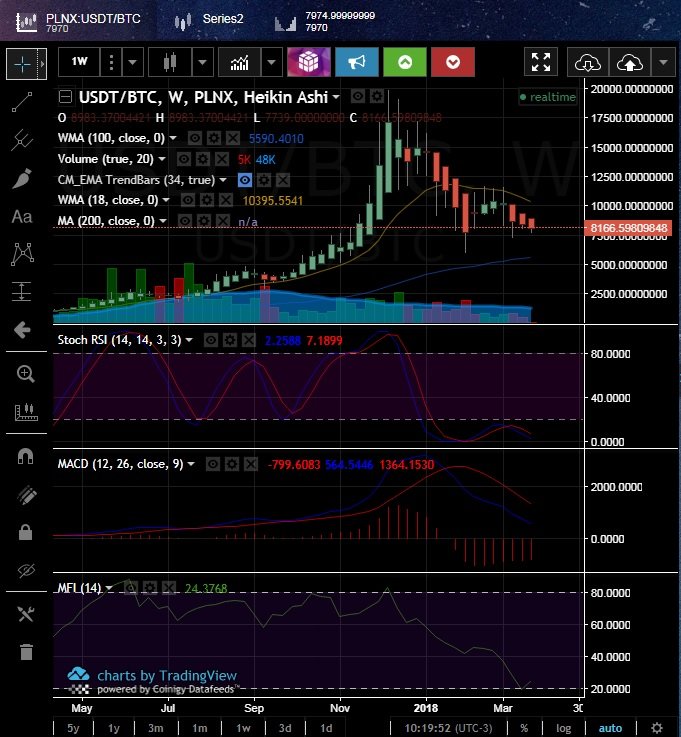
Look at this BTC chart. It is a Heikin Ashe type chart that confirms your analysis. Each tick represets 1 week, and if you look closely at the MACD, you can see that the long term trend has about 3 or 4 weeks of negative momentum left before the long trend momentum shifts to the positive side. That would put us in the end of April/beginning of May, confirming your prediction. However, I digress with one thing you said: I would also venture that BTC will rarely go below the 100 day Weighted Moving Average(WMA100, the blue line), if at all.
You are viewing a single comment's thread from: