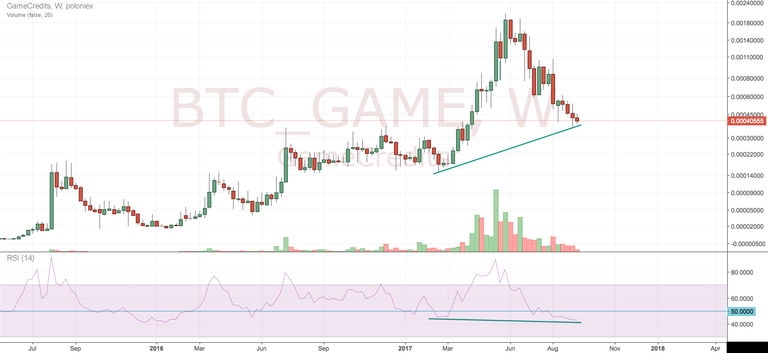
rather unconventional way to find divergence

the usual way to look for it - between the price peaks vs the indicator peaks during uptrend and the bottoms vs bottoms during the downtrend
the 2nd chart looks more like a long-term uptrend
rather unconventional way to find divergence

the usual way to look for it - between the price peaks vs the indicator peaks during uptrend and the bottoms vs bottoms during the downtrend
the 2nd chart looks more like a long-term uptrend
The way you've described is how one finds a regular divergence. The chart you've linked shows hidden
I agree that a valley hasn't yet formed on the RSI to indicate that the move is over, so it remains to be seen if that hidden divergence remains that way or gets wiped out. divergences, as described here: https://www.babypips.com/learn/forex/hidden-divergence
Either way, there's definitely a long term uptrend at play :)