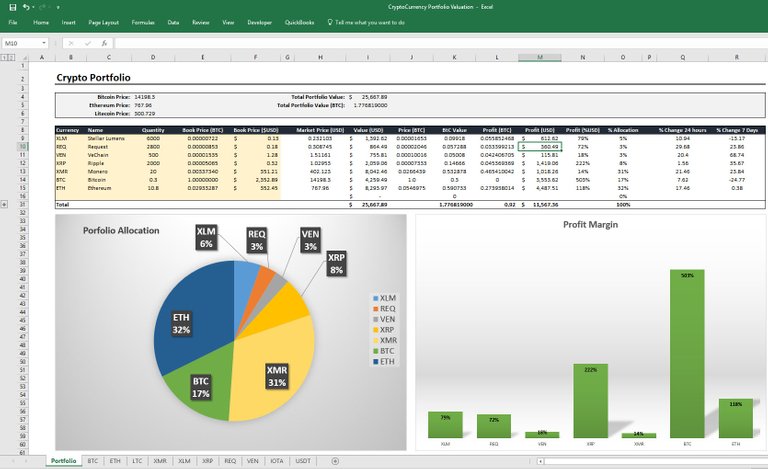
Make an Excel Crypto Portfolio Tracker that draws live prices and coin data from CoinMarketCap.com. Here is how to create your own.

If you have holdings across various exchanges (XRB at Bitgrail, BTC at GDAX, REQ at Binance...etc) this allows you to consolidate your entire portfolio, and also to value it more accurately in Satoshis and US dollars. Its also much quicker than logging into a site and allows for the full capability of Excel to analyze, you can run all the functions, graphs...etc that you want.
One of the things that the exchanges generally get terribly wrong is portfolio valuation and tracking. In addition to often not showing you the dollar price per coin, they also show the spot price at their exchange rather than the average across all exchanges. In many altcoins there can be quite a large spread in price between your exchange and the market average, and it generally always tends to move towards the average as arbitrage removes the difference. This is why its often better to value your portfolio using the prices on CoinMarketCap, which derives prices by "taking the volume weighted average of all prices reported at each market."
In my example file, I've only added the price feed for a few popular coins, but you can get live data for any coin on CMP by doing this:
Go to http://coinmarketcap.com and select the coin you are interested in.
Click the Tools tab and copy paste the link under API Tracker. For example, lets use DASH. The API tracker link can be seen on the tools page and is: https://api.coinmarketcap.com/v1/ticker/dash/
Go into the Excel spreadsheet and click the Data tab. Select New Query -> From Other Sources -> From Web, here is a screenshot. Copy paste the API link into the box, click OK.
Note: If your version of Excel doesn't have Query Editor installed by default, you can get it from the Microsoft site.
This will load the Query Editor like in this screenshot. Simply click on the Record field in the table and it should expand to look like this. Click on Convert Into Table on top.
This will make a nice table for you to import into a new spreadsheet, you can name it by changing the Name field on the right side.
Click save to import and this will make a new sheet with the name entered in the Name field. The data will automatically refresh every time you open the file. You can also manually refresh at any time by clicking Refresh All under the Data tab.
You can also make a quick macro to Refresh All and assign it to a button to add to the spreadsheet to make it even faster.
Having it all in Excel makes it easy to chart and analyze now.
I can also post the full excel file if someone is interested.
Happy investing :)
*edit: Here is the Excel file https://uploadfiles.io/d6sua